Massage Therapist Salary in Billings, MT: $44,628 (2026)
Quick Answer:A full-time massage therapist in Billings, MT earns a median $44,628/year (≈ $21.46/hour) in nominal terms for 2026 — projected from BLS OEWS 2025 (SOC 31-9011). Once you factor in Billings's price level (6% below national, BEA RPP 93.5), that paycheck buys what $47,717 would nationally. Nominal pay sits 25.1% below the Montana state average.
Official BLS data · View source
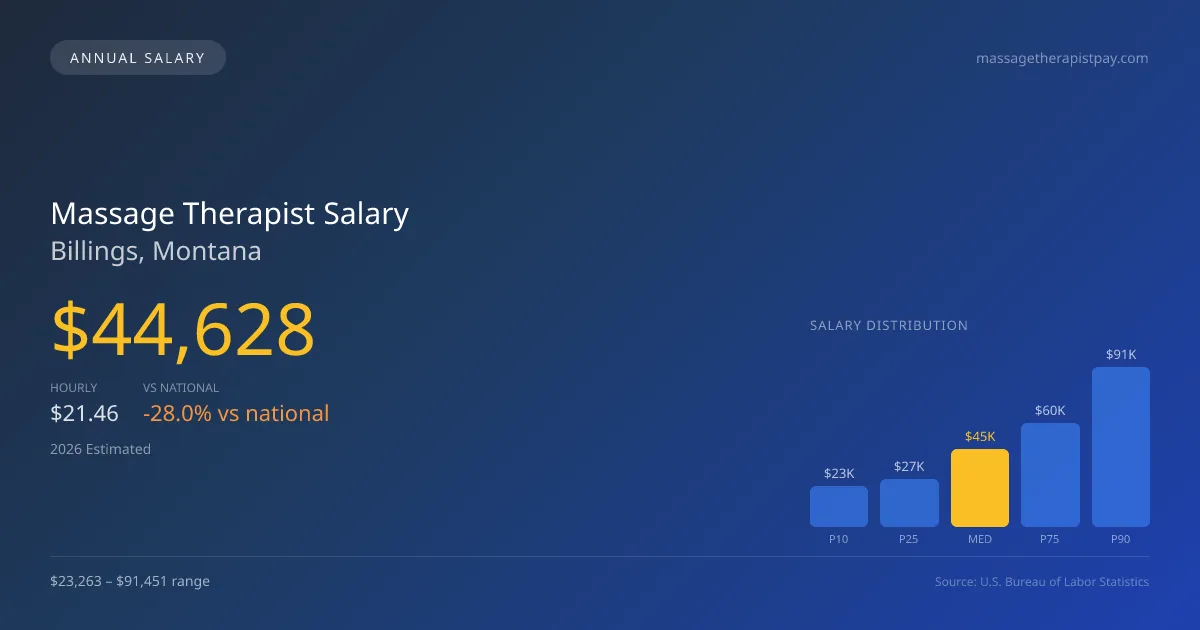
In 2026, the massage therapist salary in Billings, Montana, is projected to be approximately $44,628 annually, which is significantly lower than the national median of $61,975. This reflects the challenges of building a patient base as a self-employed therapist, especially with the need to invest in overhead and marketing. Salaries in Billings vary considerably, with an annual range from $23,263 for the lower 10% to $91,451 for the top earners. These estimates are based on 2025 BLS OEWS data, projected to 2026, and reveal the complexities of income for massage therapists in a market characterized by fluctuations in client demand and service pricing.
Salary Breakdown
| Percentile | Annual | Hourly |
|---|---|---|
| Entry Level (P10) | $23,263 | $11.19 |
| Lower Range (P25) | $27,250 | $13.11 |
| Median (P50)(typical) | $44,628 | $21.46 |
| Upper Range (P75) | $59,727 | $28.71 |
| Top Earners (P90) | $91,451 | $43.97 |
Median Salary Position
27.99% below the national average
2026 Salary Percentile Distribution in Billings
In Billings, MT, the massage therapist salary spread from the 10th to 90th percentile is $68,188 (2026 est.). At $44,628, the local median is 27.99% below the national median of $61,975.
Salary Calculator
At 40 hours/week in Billings: You'd be in the lower-middle range
How Billings Massage Therapist Pay Compares
Billings median: $44,628/year (2026)
| Compared To | Median Salary | Billings Pays |
|---|---|---|
| Montana Average | $59,583 | -25.10% less |
| National Average | $61,975 | -27.99% less |
Massage Therapists in Billings, MT earn a median of $44,628 per year (2026 est.), which is 27.99% lower than the national median of $61,975 and 25.10% below the Montana state average of $59,583.
Cost-of-Living Adjusted Salary
Billings has a cost of living 6.47% below the national average, meaning your salary goes further here.
Adjusted salary = nominal × (100 / CoL index). CoL index: 100 = national average.
Billings, MT has a cost-of-living index of 93.526 (below the national average of 100). A massage therapist earning $44,628 nominally has purchasing power equivalent to $47,717 in an average-cost city — an effective 6.92% boost.
Compare Purchasing Power
Select a city to see how your salary compares after cost of living
Select a city above to compare purchasing power
2019 BLS Actual
$33,070
2025 BLS Actual
$42,090
2026 Current Est.
$44,628
2019–2027 Growth
+43.1%
Salary Trajectory for Massage Therapists in Billings (2019–2027)
2019–2025: actual BLS OEWS data for this metro area. 2026+: CAGR 6.03% projection.
| Year | Annual Salary | Status |
|---|---|---|
| 2019 | $33,070 | Actual |
| 2020 | $31,411 | Actual |
| 2021 | $33,780 | Actual |
| 2022 | $35,904 | Actual |
| 2023 | $48,220 | Actual |
| 2024 | $50,130 | Actual |
| 2025 | $42,090 | Actual |
| 2026(current) | $44,628 | Estimated |
| 2027 | $47,319 | Projected |
Based on 7 years of BLS OEWS data for the Billings metropolitan area, the median massage therapist salary grew 27.3% from $33,070 (2019) to $42,090 (2025). At a 6.03% compound annual growth rate, salaries are projected to reach $47,319 by 2027 — a total increase of $14,249 (43.09%) from 2019.
Note: Historical values (2019–2025) are actual BLS OEWS figures for the Billings metropolitan area, sourced from annual Occupational Employment and Wage Statistics surveys. 2026–2026 figures are current estimates, and 2027 values are projections, calculated using a 6.03% CAGR derived from 7-year BLS historical data. Actual salaries may vary based on employer, experience, certifications, and local market conditions.
Salary by Experience Level
| Experience | Estimated Salary Range |
|---|---|
| 0-2 years (New Graduate) | $23,263 – $27,250 |
| 3-5 years (Mid Career) | $27,250 – $44,628 |
| 5+ years (Experienced) | $44,628 – $59,727 |
| 10+ years (Top Earner) | $59,727 – $91,451 |
LMT salary ranges estimated from BLS percentile data. Individual massage therapist compensation varies by employer, certifications, and specialization.
Massage Therapist Job Market in Billings
Despite the competitive salary landscape, Billings hosts around 40 massage therapists who must navigate a cost of living index of 93.526, indicating lower overall living expenses than the national average. This dynamic can enhance take-home purchasing power, especially for those who opt for self-employed roles where tips and specialized services can significantly increase earnings. Spas and chiropractic clinics typically offer higher compensation; however, they also impose structured pay scales that may limit earning potential compared to self-directed practices. Additionally, factors such as the nature of services provided and clientele base play a vital role in shaping the disparity found between lower and higher salaries within the region. Consequently, those looking to achieve maximum massage therapist pay in Billings MT should consider strategic networking, specializing in high-demand areas like sports or oncology massage, and developing a robust marketing approach to build an independent practice.
More salary data for Billings, MT:
Frequently Asked Questions
How much do massage therapists make in Billings, MT in 2026?
Is Billings, MT a good place to work as a massage therapist?
Can massage therapists make $100K in Billings?
What is the cost-of-living adjusted massage therapist salary in Billings?
How much does a massage therapist make per hour in Billings?
Related Pages
Compare Salaries
Career Resources
Nearby Cities in Montana
Written by Jordan Lee, LMT
Career Analyst
Jordan Lee has 10 years of experience in massage therapy. They specialize in sports massage. They work in a wellness center.
Methodology & Data Source
Salary figures on this page are 2026 projections based on the Bureau of Labor Statistics Occupational Employment and Wage Statistics (OEWS) survey, May 2026 release. The BLS reported a median annual salary of $42,090 for massage therapistsin the Billings metropolitan area. A 6.03% compound annual growth rate (CAGR), calculated from 6-year national BLS wage trends, was applied to project current 2026 compensation. Percentile ranges (P10–P90) represent the full salary distribution across experience levels and practice settings in this market.
Data Sources & Methodology
Source: BLS, OEWS, 4-year dataset (–). Per-city data from annual BLS metropolitan area surveys.
2026 figures are projected from 2025 BLS data using a compound annual growth rate (CAGR) of 6.03%, derived from historical BLS wage trends for massage therapists (SOC 31-9011).
Compiled and verified by Jordan Lee, LMT, a licensed massage therapist with 10+ years of clinical experience. · View source data at BLS.gov