Massage Therapist Salary in Montana: $64,269 (2026)
Quick Answer:Across Montana's 7 metropolitan areas, the average median massage therapist pay sits at $64,269/year heading into 2026 — a figure projected from 2025 BLS OEWS wage data for SOC 31-9011. Because Montana sits at BEA RPP 96.2 (4% below the U.S. baseline), that statewide median translates to roughly $66,808 in nationally-comparable purchasing power. Highest-paying metros: Bozeman ($85,670), Great Falls ($56,079), Missoula ($54,988).
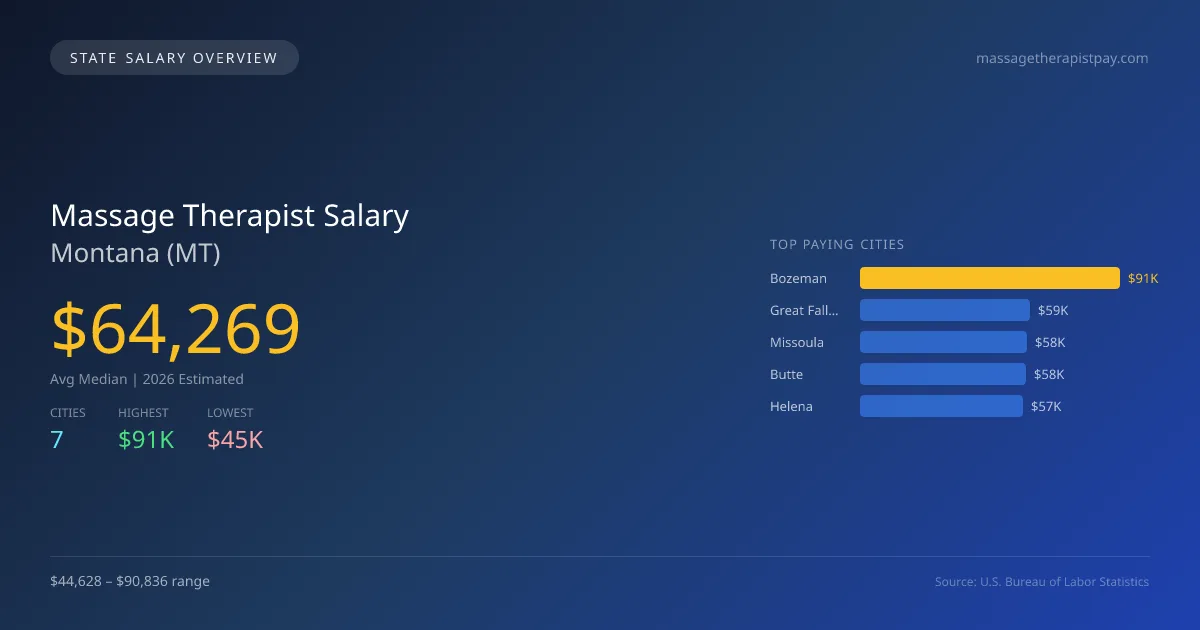
In Montana, the average median salary for massage therapists in 2026 is projected to be $64,269, which is 3.7% higher than the national median of $61,975. This indicates a favorable salary environment for the profession compared to the rest of the nation. However, there is a significant salary disparity across the state, with Bozeman offering the highest average salary at $90,836, while Billings has the lowest at $44,628. The primary reasons for this difference include the local cost of living, demand for wellness services, and the concentration of affluent clientele in certain areas. Montana's licensing requirements for massage therapists include specific educational credentials and state exams, which help ensure a quality standard within the industry. The scope of practice laws are established to define the types of services that practitioners can legally provide. Demand for massage therapy is driven by a growing awareness of holistic health benefits, an increasing number of health and wellness facilities, and various tourism and recreation activities that attract clients seeking relaxation treatments. The job market for massage therapists in Montana shows a projected growth rate of 6.03%, suggesting a positive outlook for future employment opportunities. With a total of 126 massage therapists employed statewide, cities like Great Falls, Missoula, Butte, and Helena reflect a diversity in earnings, with salaries ranging from $57,093 to $59,461, underscoring the varied opportunities across the region.
Montana Massage Therapist Salary Range
Overall salary range in Montana: $23,263 (lowest entry-level) to $103,740 (highest top earner)
Montana vs National Average
Montana massage therapists earn 3.70% more than the national median (+$2,294/year difference).
Montana Massage Therapist Salary Distribution (2026)
Massage Therapist salaries in Montana range from $27,817 (entry-level, 10th percentile) to $94,925 (top earners, 90th percentile), with a median of $64,269. The Montana median is $2,294 above the US national median of $61,975. The average hourly rate is $30.90/hr. Approximately 126 massage therapists are employed across 7 cities.
2019 BLS Actual
$45,614
2025 BLS Actual
$60,614
2026 Current Est.
$64,269
2019–2027 Growth
+49.4%
Salary Trajectory for Massage Therapists in Montana (2019–2027)
2019–2025: actual BLS OEWS data for this metro area. 2026+: CAGR 6.03% projection.
| Year | Annual Salary | Status |
|---|---|---|
| 2019 | $45,614 | Actual |
| 2020 | $45,235 | Actual |
| 2021 | $47,980 | Actual |
| 2022 | $44,110 | Actual |
| 2023 | $46,110 | Actual |
| 2024 | $53,733 | Actual |
| 2025 | $60,614 | Actual |
| 2026(current) | $64,269 | Estimated |
| 2027 | $68,144 | Projected |
Based on 7 years of BLS OEWS data for the Montana metropolitan area, the median massage therapist salary grew 32.9% from $45,614 (2019) to $60,614 (2025). At a 6.03% compound annual growth rate, salaries are projected to reach $68,144 by 2027 — a total increase of $22,530 (49.39%) from 2019.
Note: Historical values (2019–2025) are actual BLS OEWS figures for the Montana metropolitan area, sourced from annual Occupational Employment and Wage Statistics surveys. 2026–2026 figures are current estimates, and 2027 values are projections, calculated using a 6.03% CAGR derived from 7-year BLS historical data. Actual salaries may vary based on employer, experience, certifications, and local market conditions.
Top 5 Highest Paying Cities in Montana
Lowest Paying Cities in Montana
Best Value Cities for Massage Therapists in Montana
When adjusted for local cost of living, these Montana cities offer the most purchasing power for massage therapists.
| City | Nominal Salary | CoL Index | Adjusted Salary |
|---|---|---|---|
| Bozeman | $90,836 | 102.51 | $88,612 |
| Great Falls | $59,461 | 96.2 | $61,810 |
| Missoula | $58,304 | 96.2 | $60,607 |
| Butte | $57,940 | 96.2 | $60,229 |
| Helena | $57,093 | 96.2 | $59,348 |
Adjusted salary = nominal salary × (100 / CoL index). CoL index: 100 = national average. Lower index = lower cost of living.
Salary by Experience Level in Montana
| Experience Level | Estimated Annual |
|---|---|
| Entry Level (0-2 years) | $27,817 |
| Mid Career (3-7 years) | $64,269 |
| Experienced (7+ years) | $94,925 |
Estimates based on BLS percentile data averaged across Montana metro areas. Individual pay varies by employer, certifications, and specialization.
All 7 Cities in Montana
More Montana Salary Data
Senior / Experienced
Top earner salaries for experienced massage therapists.
Explore More Massage Therapist Salary Data
Frequently Asked Questions
How much do massage therapists make in Montana in 2026?
What is the highest paying city for massage therapists in Montana?
How does Montana massage therapist pay compare to the national average?
What is the entry-level massage therapist salary in Montana?
How many massage therapists are employed in Montana?
Which Montana city offers the best value for massage therapists?
Written by Jordan Lee, LMT
Career Analyst
Jordan Lee has 10 years of experience in massage therapy. They specialize in sports massage. They work in a wellness center.
Methodology & Data Source
Statewide salary figures on this page are 2026 projections based on the Bureau of Labor Statistics Occupational Employment and Wage Statistics (OEWS) survey, May 2026 release. A 6.03% compound annual growth rate (CAGR), derived from 6-year national BLS wage trends, was applied to each metro area's reported salary to estimate current 2026 massage therapist compensation across Montana. State averages are employment-weighted across 7 metro areas — larger metro areas with more massage therapistscontribute proportionally more to the average, producing figures that better reflect typical compensation. Individual pay varies by city, employer, certifications, and experience.
Data Sources & Methodology
Source: BLS, OEWS, 6-year dataset (–). Per-city data from annual BLS metropolitan area surveys.
2026 figures are projected from 2025 BLS data using a compound annual growth rate (CAGR) of 6.03%, derived from historical BLS wage trends for massage therapists (SOC 31-9011).
Compiled and verified by Jordan Lee, LMT, a licensed massage therapist with 10+ years of clinical experience. · View source data at BLS.gov