Massage Therapist Salary in Richmond, CA: $54,180 (2026)
Quick Answer:A full-time massage therapist in Richmond, CA earns a median $54,180/year (≈ $26.05/hour) in nominal terms for 2026 — projected from BLS OEWS 2025 (SOC 31-9011). Once you factor in Richmond's price level (13% above national, BEA RPP 113.1), that paycheck buys what $47,905 would nationally. Nominal pay sits 1.9% above the California state average.
Based on BLS state-level estimates · View source
In Richmond, California, the projected massage therapist salary in 2026 is $54,180 per year, reflecting a unique local market landscape where compensation differs notably across employment types. The pay structure reveals a wide range, from $31,424 at the lower end (P10) to a lucrative $83,979 at the higher end (P90). Employment in franchise chains such as Massage Envy and Hand & Stone typically offers lower salary averages but provides consistent bookings, attracting entry-level therapists. Conversely, self-employed massage therapists can achieve significantly higher earnings, especially if they specialize or implement effective marketing strategies. These figures are derived from estimates based on 2025 BLS data, adjusted for living costs in Richmond, which overall indicate a robust job market for the profession in the area.
About the Richmond Market
Salary estimated from California average ($58,000) adjusted for local cost of living.
Salary Breakdown
| Percentile | Annual | Hourly |
|---|---|---|
| Entry Level (P10) | $31,424 | $15.11 |
| Lower Range (P25) | $39,009 | $18.76 |
| Median (P50)(typical) | $54,180 | $26.05 |
| Upper Range (P75) | $69,351 | $33.35 |
| Top Earners (P90) | $83,979 | $40.38 |
Median Salary Position
12.58% below the national average
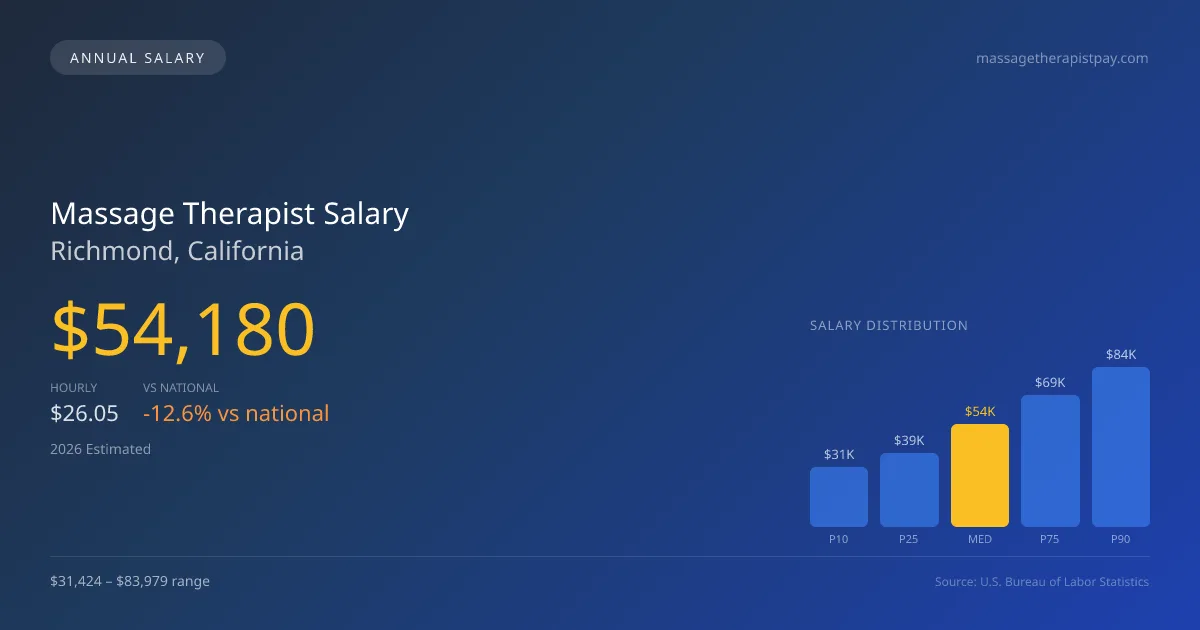
2026 Salary Percentile Distribution in Richmond
In Richmond, CA, the massage therapist salary spread from the 10th to 90th percentile is $52,555 (2026 est.). At $54,180, the local median is 12.58% below the national median of $61,975.
Salary Calculator
At 40 hours/week in Richmond: You'd be in the lower-middle range
How Richmond Massage Therapist Pay Compares
Richmond median: $54,180/year (2026)
| Compared To | Median Salary | Richmond Pays |
|---|---|---|
| California Average | $53,170 | +1.90% more |
| National Average | $61,975 | -12.58% less |
Massage Therapists in Richmond, CA earn a median of $54,180 per year (2026 est.), which is 12.58% lower than the national median of $61,975 and 1.90% above the California state average of $53,170.
Cost-of-Living Adjusted Salary
Richmond has a cost of living 13.10% above the national average.
Adjusted salary = nominal × (100 / CoL index). CoL index: 100 = national average.
Richmond, CA has a cost-of-living index of 113.1 (above the national average of 100). While the nominal salary of $54,180 is competitive, the higher cost of living reduces purchasing power to an effective $47,905 — a 11.58% reduction.
Compare Purchasing Power
Select a city to see how your salary compares after cost of living
Select a city above to compare purchasing power
2019 BLS Actual
$37,435
2025 BLS Actual
$51,099
2026 Current Est.
$54,180
2019–2027 Growth
+53.5%
Salary Trajectory for Massage Therapists in Richmond (2019–2027)
2019–2025: actual BLS OEWS data for this metro area. 2026+: CAGR 6.03% projection.
| Year | Annual Salary | Status |
|---|---|---|
| 2019 | $37,435 | Actual |
| 2020 | $38,134 | Actual |
| 2021 | $41,010 | Actual |
| 2022 | $43,589 | Actual |
| 2023 | $48,354 | Actual |
| 2024 | $66,840 | Actual |
| 2025 | $51,099 | Actual |
| 2026(current) | $54,180 | Estimated |
| 2027 | $57,447 | Projected |
Based on 7 years of BLS OEWS data for the Richmond metropolitan area, the median massage therapist salary grew 36.5% from $37,435 (2019) to $51,099 (2025). At a 6.03% compound annual growth rate, salaries are projected to reach $57,447 by 2027 — a total increase of $20,012 (53.46%) from 2019.
Note: Historical values (2019–2025) are actual BLS OEWS figures for the Richmond metropolitan area, sourced from annual Occupational Employment and Wage Statistics surveys. 2026–2026 figures are current estimates, and 2027 values are projections, calculated using a 6.03% CAGR derived from 7-year BLS historical data. Actual salaries may vary based on employer, experience, certifications, and local market conditions.
Salary by Experience Level
| Experience | Estimated Salary Range |
|---|---|
| 0-2 years (New Graduate) | $31,424 – $39,009 |
| 3-5 years (Mid Career) | $39,009 – $54,180 |
| 5+ years (Experienced) | $54,180 – $69,351 |
| 10+ years (Top Earner) | $69,351 – $83,979 |
LMT salary ranges estimated from BLS percentile data. Individual massage therapist compensation varies by employer, certifications, and specialization.
Massage Therapist Job Market in Richmond
Examining Richmond's job market further, there are currently 25 employed massage therapists, illustrating a moderate yet stable industry presence. The city's cost-of-living index sits at 113.1, meaning that while salaries may be slightly lower than the national average, higher living costs may impact take-home pay. Among various work environments, chiropractic and physical therapy clinics often offer more competitive pay than standard spas, partially influenced by the specialized skills and training involved. Factors like tips, which can vary from 15-25% of session fees at spas, and differences in compensation structures between employed therapists and self-employed practitioners create a significant wage disparity. To maximize earning potential in Richmond, therapists should consider targeting high-end clientele, diversifying service offerings, and promoting unique specializations.
More salary data for Richmond, CA:
Frequently Asked Questions
How much do massage therapists make in Richmond, CA in 2026?
Is Richmond, CA a good place to work as a massage therapist?
Can massage therapists make $100K in Richmond?
What is the cost-of-living adjusted massage therapist salary in Richmond?
How much does a massage therapist make per hour in Richmond?
Related Pages
Compare Salaries
Career Resources
Nearby Cities in California
Written by Jordan Lee, LMT
Career Analyst
Jordan Lee has 10 years of experience in massage therapy. They specialize in sports massage. They work in a wellness center.
Methodology & Data Source
Salary figures on this page are 2026 projections based on the Bureau of Labor Statistics Occupational Employment and Wage Statistics (OEWS) survey, May 2026 release. The BLS reported a median annual salary of $51,099 for massage therapistsin the Richmond metropolitan area. A 6.03% compound annual growth rate (CAGR), calculated from 6-year national BLS wage trends, was applied to project current 2026 compensation. Percentile ranges (P10–P90) represent the full salary distribution across experience levels and practice settings in this market.
Data Sources & Methodology
Salary data for Richmond is estimated from official BLS state-level occupational wage data (2025), adjusted for regional cost-of-living differences using BEA RPP (Regional Price Parities).
2026 figures are projected from 2025 BLS data using a compound annual growth rate (CAGR) of 6.03%, derived from historical BLS wage trends for massage therapists (SOC 31-9011).
Compiled and verified by Jordan Lee, LMT, a licensed massage therapist with 10+ years of clinical experience. · View source data at BLS.gov