Massage Therapist Hourly Pay in Richmond, CA: $26.05 (2026)
Quick Answer:Hourly pay for a massage therapist working in Richmond, CA runs $26.05 at the median for 2026 — annualizing to $54,180 at a standard 2,080-hour year. Figures projected from BLS OEWS 2025 (SOC 31-9011). Weighted against Richmond's regional price level (BEA RPP 113.1, 13% above national), each hour of work buys what $23.03 nationally would. A 24-hour part-time schedule grosses $32,512 per year.
Based on BLS state-level estimates · View source
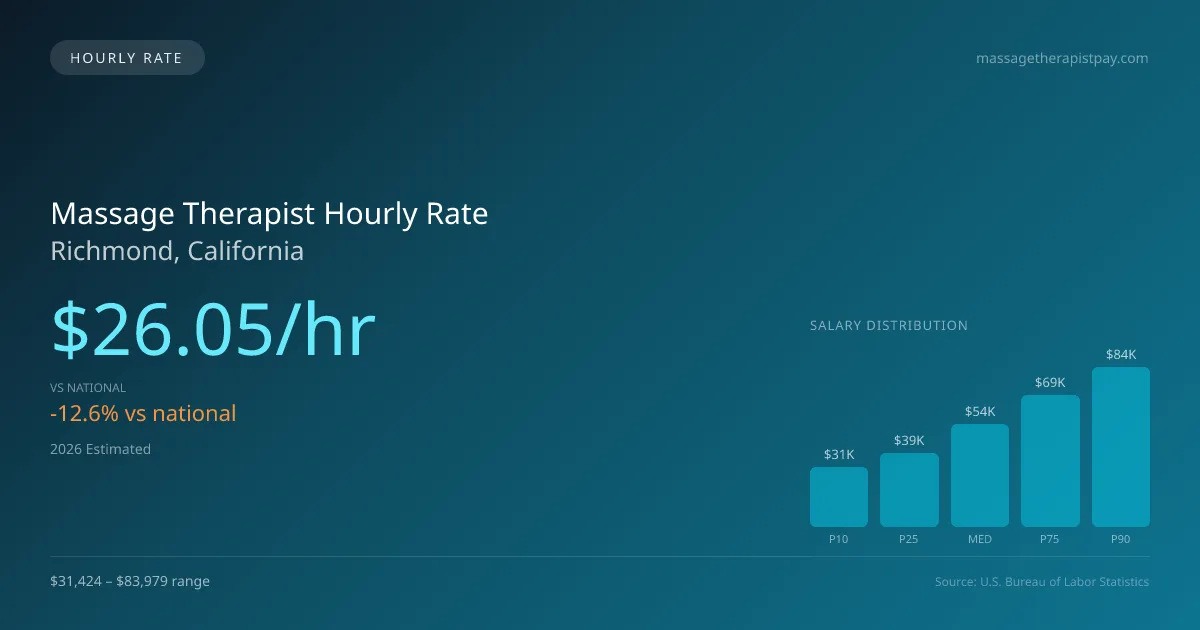
In Richmond, California, the projected median hourly rate for massage therapists in 2026 is $26.05. This figure falls below the national median of $29.80, reflecting localized economic variations. For those working part-time, such as three days a week, the pay translates into significant opportunities within various employment settings, including spas, chiropractic offices, and mobile practices. Entry-level massage therapists in Richmond can expect to earn around $15.11 per hour, while more experienced professionals can earn as much as $40.38 per hour. This wide range allows for potential earnings based on skill, experience, and the type of establishment, helping shape a promising pay scale for both part-time and per-diem workers in the industry.
About the Richmond Market
Salary estimated from California average ($58,000) adjusted for local cost of living.
Massage Therapist Hourly Wage Breakdown
| Percentile | Hourly Rate | Per 8hr Shift |
|---|---|---|
| Entry Level (P10) | $15.11 | $120.87 |
| Lower Range (P25) | $18.76 | $150.05 |
| Median (P50) | $26.05 | $208.41 |
| Upper Range (P75) | $33.35 | $266.77 |
| Top Earners (P90) | $40.38 | $323.01 |
Estimated Annual Income by Work Schedule in Richmond
Based on $26.05/hr median hourly rate · 2026 est.
At $26.05/hr, a massage therapist working full-time (40 hr/wk) in Richmond, CA can expect to earn approximately $54,187 per year (2026 est.). Part-time hygienists working 24 hours per week would earn around $31,262. With a cost-of-living index of 113.10 (above the national average), these earnings may be offset by higher expenses in Richmond.
Hourly Rate Calculator
Schedule Comparison in Richmond
| Schedule | Weekly | Monthly | Annual |
|---|---|---|---|
| Full-Time (40 hrs) | $1,042.06 | $4,516 | $54,187 |
| Part-Time (24 hrs) | $625.24 | $2,709 | $32,512 |
| Per Diem (16 hrs) | $416.83 | $1,806 | $21,675 |
Compare LMT Wages With Similar Roles
| Role | Median Hourly |
|---|---|
| Massage Therapist (Richmond) | $26.05 |
| Physical Therapist Assistant (National Avg) | $31.26 |
| Occupational Therapy Assistant (National Avg) | $32.45 |
| Medical Assistant (National Avg) | $20.14 |
| Exercise Trainer/Fitness Instructor (National Avg) | $23.95 |
Massage Therapists in Richmond, CA earn a median of $54,180 per year (2026 est.), which is 12.58% lower than the national median of $61,975 and 1.90% above the California state average of $53,170.
Massage Therapist Hourly Pay vs. Cost of Living
Working 24h/week at $26.05/hr = $32,512/year (purchasing power: $28,747).
Working 40h/week (full-time) = $54,187/year (purchasing power: $47,911).
CoL index: 113.1 (100 = national average).
2019 BLS Actual
$18.00/hr
2025 BLS Actual
$24.57/hr
2026 Current Est.
$26.05/hr
2019–2027 Growth
+53.5%
Hourly Rate Trajectory for Massage Therapists in Richmond (2019–2027)
2019–2025: actual BLS OEWS data for this metro area. 2026+: CAGR 6.03% projection.
| Year | Hourly Rate | Status |
|---|---|---|
| 2019 | $18.00/hr | Actual |
| 2020 | $18.34/hr | Actual |
| 2021 | $19.72/hr | Actual |
| 2022 | $20.96/hr | Actual |
| 2023 | $23.25/hr | Actual |
| 2024 | $32.13/hr | Actual |
| 2025 | $24.57/hr | Actual |
| 2026(current) | $26.05/hr | Estimated |
| 2027 | $27.62/hr | Projected |
Based on 7 years of BLS OEWS metropolitan area data, the median hourly rate for massage therapists in Richmond grew 36.5% from $18.00/hr (2019) to $24.57/hr (2025). At a 6.03% projected growth rate, hourly pay is expected to reach $27.62/hr by 2027. Part-time and per-diem massage therapists can use this multi-year trend to benchmark future contract negotiations.
Note: Historical values (2019–2025) are actual BLS OEWS figures for the Richmond metropolitan area, sourced from annual Occupational Employment and Wage Statistics surveys. 2026–2026 figures are current estimates, and 2027 values are projections, calculated using a 6.03% CAGR derived from 7-year BLS historical data. Actual salaries may vary based on employer, experience, certifications, and local market conditions.
Working as an Hourly Massage Therapist in Richmond
When analyzing the financial prospects for part-time massage therapists, one can see a notable difference in earnings compared to full-time employees. Working three days a week, totaling approximately 24 hours, could yield an annual income of roughly $30,000, which is still lower than full-time counterparts, yet it offers flexibility for those balancing other commitments. Per-diem arrangements highlight another layer, with therapists frequently charging between $25 and $100 per session based on employer-type, such as spa chains versus independent practices. Self-employed therapists can see rates soar to as high as $150 for a session. While some may accept lower rates in exchange for the benefits provided by franchises like Massage Envy or Hand & Stone, those taking the independent route often face higher operating costs. Negotiating strategies can be crucial in Richmond, emphasizing the importance of clarifying terms and ensuring fair compensation in this evolving field.
More salary data for Richmond, CA:
Frequently Asked Questions
What is the hourly rate for massage therapists in Richmond in 2026?
How much do part-time massage therapists make in Richmond?
Are massage therapists in Richmond paid hourly or salary?
How much does a full-time massage therapist make per year in Richmond?
Do massage therapists earn more per hour working part-time in Richmond?
Related Pages
Compare Salaries
Career Resources
Nearby Cities in California
Written by Jordan Lee, LMT
Career Analyst
Jordan Lee has 10 years of experience in massage therapy. They specialize in sports massage. They work in a wellness center.
Methodology & Data Source
Hourly wage figures on this page are 2026 projections based on the Bureau of Labor Statistics Occupational Employment and Wage Statistics (OEWS) survey, May 2026 release. A 6.03% compound annual growth rate (CAGR), derived from 6-year national BLS wage trends, was applied to estimate current 2026 hourly rates for massage therapists in Richmond. Part-time and full-time income estimates assume consistent weekly hours and do not account for overtime, benefits, or seasonal variation.
Data Sources & Methodology
Salary data for Richmond is estimated from official BLS state-level occupational wage data (2025), adjusted for regional cost-of-living differences using BEA RPP (Regional Price Parities).
2026 figures are projected from 2025 BLS data using a compound annual growth rate (CAGR) of 6.03%, derived from historical BLS wage trends for massage therapists (SOC 31-9011).
Compiled and verified by Jordan Lee, LMT, a licensed massage therapist with 10+ years of clinical experience. · View source data at BLS.gov