Massage Therapist Salary in Richland, WA: $86,537 (2026)
Quick Answer:A full-time massage therapist in Richland, WA earns a median $86,537/year (≈ $41.61/hour) in nominal terms for 2026 — projected from BLS OEWS 2025 (SOC 31-9011). Once you factor in Richland's price level (7% above national, BEA RPP 107.4), that paycheck buys what $80,574 would nationally. Nominal pay sits 0.3% below the Washington state average.
Based on BLS state-level estimates · View source
For massage therapists in Richland, Washington, the financial landscape appears quite favorable as of 2026, with median annual compensation estimated at $86,537. This figure significantly exceeds the national median of $61,975, highlighting Richland’s robust market for massage therapy. The broad salary range, from $50,191 at the 10th percentile to $134,133 at the 90th percentile, reflects the diverse income potential based on experience and specialization. These figures are informed by local estimates derived from 2025 BLS data, factoring in regional price adjustments, putting Richland's massage therapist pay in a solid position within the industry.
About the Richland Market
Salary estimated from Washington average ($64,000) adjusted for local cost of living.
Salary Breakdown
| Percentile | Annual | Hourly |
|---|---|---|
| Entry Level (P10) | $50,191 | $24.13 |
| Lower Range (P25) | $63,531 | $30.55 |
| Median (P50)(typical) | $86,537 | $41.61 |
| Upper Range (P75) | $110,767 | $53.26 |
| Top Earners (P90) | $134,133 | $64.49 |
Median Salary Position
39.63% above the national average
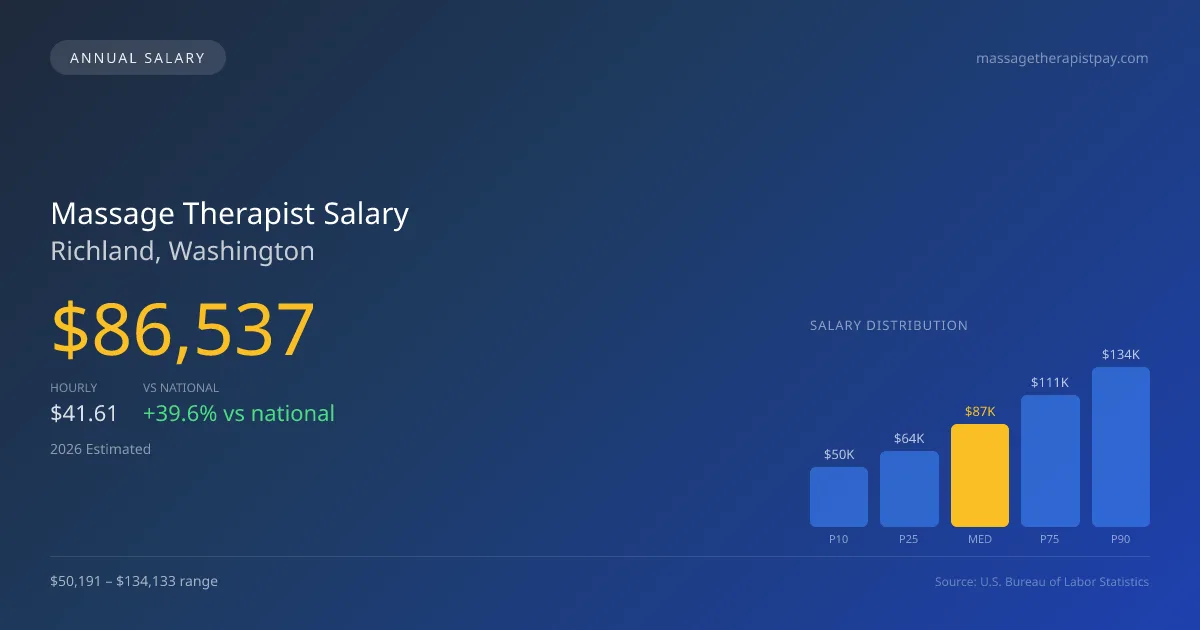
2026 Salary Percentile Distribution in Richland
In Richland, WA, the massage therapist salary spread from the 10th to 90th percentile is $83,942 (2026 est.). At $86,537, the local median is 39.63% above the national median of $61,975.
Salary Calculator
At 40 hours/week in Richland: You'd be in the lower-middle range
How Richland Massage Therapist Pay Compares
Richland median: $86,537/year (2026)
| Compared To | Median Salary | Richland Pays |
|---|---|---|
| Washington Average | $86,798 | -0.30% less |
| National Average | $61,975 | +39.63% more |
Massage Therapists in Richland, WA earn a median of $86,537 per year (2026 est.), which is 39.63% higher than the national median of $61,975 and 0.30% below the Washington state average of $86,798.
Cost-of-Living Adjusted Salary
Richland has a cost of living 7.40% above the national average.
Adjusted salary = nominal × (100 / CoL index). CoL index: 100 = national average.
Richland, WA has a cost-of-living index of 107.4 (above the national average of 100). While the nominal salary of $86,537 is competitive, the higher cost of living reduces purchasing power to an effective $80,574 — a 6.89% reduction.
Compare Purchasing Power
Select a city to see how your salary compares after cost of living
Select a city above to compare purchasing power
2019 BLS Actual
$59,791
2025 BLS Actual
$81,616
2026 Current Est.
$86,537
2019–2027 Growth
+53.5%
Salary Trajectory for Massage Therapists in Richland (2019–2027)
2019–2025: actual BLS OEWS data for this metro area. 2026+: CAGR 6.03% projection.
| Year | Annual Salary | Status |
|---|---|---|
| 2019 | $59,791 | Actual |
| 2020 | $60,908 | Actual |
| 2021 | $65,502 | Actual |
| 2022 | $69,621 | Actual |
| 2023 | $77,231 | Actual |
| 2024 | $69,467 | Actual |
| 2025 | $81,616 | Actual |
| 2026(current) | $86,537 | Estimated |
| 2027 | $91,756 | Projected |
Based on 7 years of BLS OEWS data for the Richland metropolitan area, the median massage therapist salary grew 36.5% from $59,791 (2019) to $81,616 (2025). At a 6.03% compound annual growth rate, salaries are projected to reach $91,756 by 2027 — a total increase of $31,965 (53.46%) from 2019.
Note: Historical values (2019–2025) are actual BLS OEWS figures for the Richland metropolitan area, sourced from annual Occupational Employment and Wage Statistics surveys. 2026–2026 figures are current estimates, and 2027 values are projections, calculated using a 6.03% CAGR derived from 7-year BLS historical data. Actual salaries may vary based on employer, experience, certifications, and local market conditions.
Salary by Experience Level
| Experience | Estimated Salary Range |
|---|---|
| 0-2 years (New Graduate) | $50,191 – $63,531 |
| 3-5 years (Mid Career) | $63,531 – $86,537 |
| 5+ years (Experienced) | $86,537 – $110,767 |
| 10+ years (Top Earner) | $110,767 – $134,133 |
LMT salary ranges estimated from BLS percentile data. Individual massage therapist compensation varies by employer, certifications, and specialization.
Massage Therapist Job Market in Richland
The job market for massage therapists in Richland is relatively small, employing about 15 professionals, but the competitive salary range suggests opportunities exist for meaningful earnings. With a cost-of-living index of 107.4, therapists must consider the financial implications when evaluating take-home pay. Health clinics and chiropractic offices typically offer better pay compared to franchise chains like Massage Envy and Hand & Stone, which usually provide less compensation but stable bookings. The income variations here stem from several factors, including opportunities for tips in spa settings, the gap between employed and self-employed rates, and specialization in high-demand areas such as sports or prenatal massage. For those looking to maximize their earnings in Richland’s market, building a loyal client base through effective self-marketing and potentially expanding into mobile services can significantly enhance overall pay and job satisfaction.
More salary data for Richland, WA:
Frequently Asked Questions
How much do massage therapists make in Richland, WA in 2026?
Is Richland, WA a good place to work as a massage therapist?
Can massage therapists make $100K in Richland?
What is the cost-of-living adjusted massage therapist salary in Richland?
How much does a massage therapist make per hour in Richland?
Related Pages
Compare Salaries
Career Resources
Nearby Cities in Washington
Written by Jordan Lee, LMT
Career Analyst
Jordan Lee has 10 years of experience in massage therapy. They specialize in sports massage. They work in a wellness center.
Methodology & Data Source
Salary figures on this page are 2026 projections based on the Bureau of Labor Statistics Occupational Employment and Wage Statistics (OEWS) survey, May 2026 release. The BLS reported a median annual salary of $81,616 for massage therapistsin the Richland metropolitan area. A 6.03% compound annual growth rate (CAGR), calculated from 6-year national BLS wage trends, was applied to project current 2026 compensation. Percentile ranges (P10–P90) represent the full salary distribution across experience levels and practice settings in this market.
Data Sources & Methodology
Salary data for Richland is estimated from official BLS state-level occupational wage data (2025), adjusted for regional cost-of-living differences using BEA RPP (Regional Price Parities).
2026 figures are projected from 2025 BLS data using a compound annual growth rate (CAGR) of 6.03%, derived from historical BLS wage trends for massage therapists (SOC 31-9011).
Compiled and verified by Jordan Lee, LMT, a licensed massage therapist with 10+ years of clinical experience. · View source data at BLS.gov