Massage Therapist Salary in Bellingham, WA: $88,843 (2026)
Quick Answer:A full-time massage therapist in Bellingham, WA earns a median $88,843/year (≈ $42.71/hour) in nominal terms for 2026 — projected from BLS OEWS 2025 (SOC 31-9011). Once you factor in Bellingham's price level (3% above national, BEA RPP 103.3), that paycheck buys what $85,977 would nationally. Nominal pay sits 2.4% above the Washington state average.
Official BLS data · View source
The projected median annual salary for massage therapists in Bellingham, Washington, is estimated at $88,843 for 2026, reflecting a significant pay gradient when comparing franchise employment like Massage Envy and Hand & Stone to independent and self-employed practitioners. Salary ranges in this market extend from $64,625 for the lowest earners to $122,602 for the top performers. This data stems from the Bureau of Labor Statistics (BLS) Occupational Employment and Wage Statistics and indicates that massage therapist pay in Bellingham is notably higher than the national median of $61,975, illustrating the robust demand for skilled professionals in this region. With an annual growth rate of 6.03% projected for the next five years, the local labor market is likely to continue flourishing for massage therapy practitioners.
Salary Breakdown
| Percentile | Annual | Hourly |
|---|---|---|
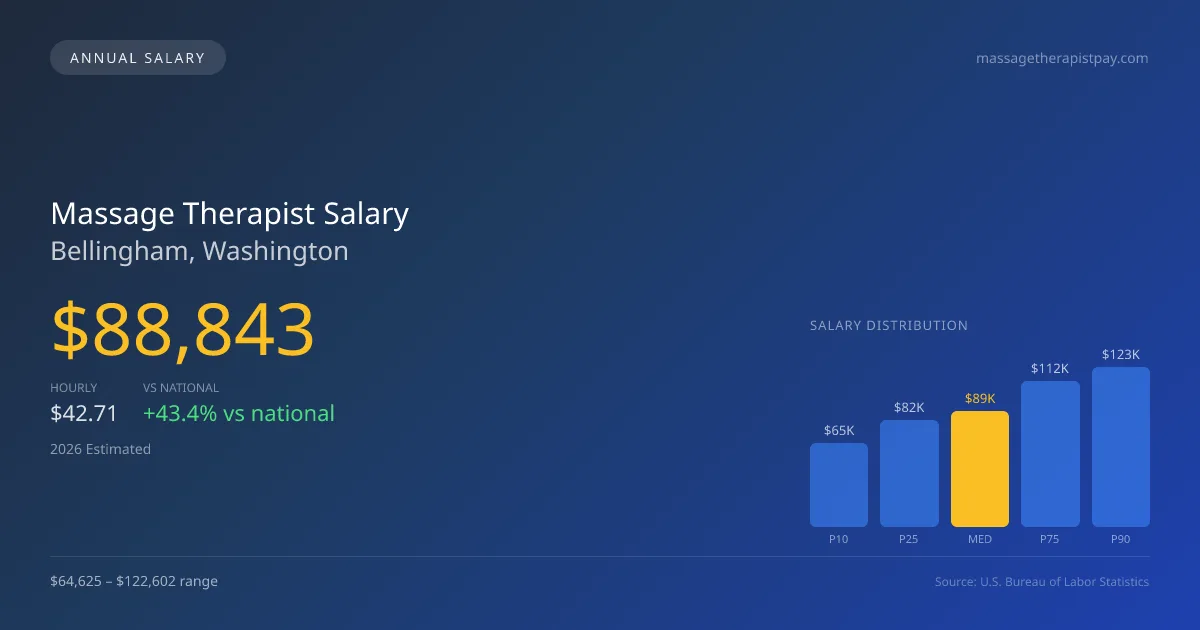
| Entry Level (P10) | $64,625 | $31.07 |
| Lower Range (P25) | $81,717 | $39.28 |
| Median (P50)(typical) | $88,843 | $42.71 |
| Upper Range (P75) | $111,533 | $53.62 |
| Top Earners (P90) | $122,602 | $58.94 |
Median Salary Position
43.35% above the national average
2026 Salary Percentile Distribution in Bellingham
In Bellingham, WA, the massage therapist salary spread from the 10th to 90th percentile is $57,977 (2026 est.). At $88,843, the local median is 43.35% above the national median of $61,975.
Salary Calculator
At 40 hours/week in Bellingham: You'd be in the lower-middle range
How Bellingham Massage Therapist Pay Compares
Bellingham median: $88,843/year (2026)
| Compared To | Median Salary | Bellingham Pays |
|---|---|---|
| Washington Average | $86,760 | +2.40% more |
| National Average | $61,975 | +43.35% more |
Massage Therapists in Bellingham, WA earn a median of $88,843 per year (2026 est.), which is 43.35% higher than the national median of $61,975 and 2.40% above the Washington state average of $86,760.
Cost-of-Living Adjusted Salary
Bellingham has a cost of living 3.33% above the national average.
Adjusted salary = nominal × (100 / CoL index). CoL index: 100 = national average.
Bellingham, WA has a cost-of-living index of 103.334 (above the national average of 100). While the nominal salary of $88,843 is competitive, the higher cost of living reduces purchasing power to an effective $85,977 — a 3.23% reduction.
Compare Purchasing Power
Select a city to see how your salary compares after cost of living
Select a city above to compare purchasing power
2019 BLS Actual
$62,430
2025 BLS Actual
$83,790
2026 Current Est.
$88,843
2019–2027 Growth
+50.9%
Salary Trajectory for Massage Therapists in Bellingham (2019–2027)
2019–2025: actual BLS OEWS data for this metro area. 2026+: CAGR 6.03% projection.
| Year | Annual Salary | Status |
|---|---|---|
| 2019 | $62,430 | Actual |
| 2020 | $62,700 | Actual |
| 2021 | $60,750 | Actual |
| 2022 | $68,640 | Actual |
| 2023 | $74,720 | Actual |
| 2024 | $87,980 | Actual |
| 2025 | $83,790 | Actual |
| 2026(current) | $88,843 | Estimated |
| 2027 | $94,200 | Projected |
Based on 7 years of BLS OEWS data for the Bellingham metropolitan area, the median massage therapist salary grew 34.2% from $62,430 (2019) to $83,790 (2025). At a 6.03% compound annual growth rate, salaries are projected to reach $94,200 by 2027 — a total increase of $31,770 (50.89%) from 2019.
Note: Historical values (2019–2025) are actual BLS OEWS figures for the Bellingham metropolitan area, sourced from annual Occupational Employment and Wage Statistics surveys. 2026–2026 figures are current estimates, and 2027 values are projections, calculated using a 6.03% CAGR derived from 7-year BLS historical data. Actual salaries may vary based on employer, experience, certifications, and local market conditions.
Salary by Experience Level
| Experience | Estimated Salary Range |
|---|---|
| 0-2 years (New Graduate) | $64,625 – $81,717 |
| 3-5 years (Mid Career) | $81,717 – $88,843 |
| 5+ years (Experienced) | $88,843 – $111,533 |
| 10+ years (Top Earner) | $111,533 – $122,602 |
LMT salary ranges estimated from BLS percentile data. Individual massage therapist compensation varies by employer, certifications, and specialization.
Massage Therapist Job Market in Bellingham
In Bellingham, approximately 140 massage therapists are currently employed, contributing to a competitive job market. While the cost of living index for the area stands at 103.334, higher expenses can affect take-home pay, making it essential for practitioners to strategize effectively. Motels and high-end spas generally provide the highest wages, whereas franchise chains may offer lower base pay. The gap in earnings often stems from employment structures; self-employed therapists can earn significantly more per hour but must manage their own overhead, marketing, and client retention. Specialty fields such as sports and oncology massage may also command higher rates, and tips from clients are a considerable factor in overall income, sometimes adding 15-25% to base fees. To maximize compensation, practitioners might consider pursuing advanced certifications or focusing on niche markets, ensuring they leverage the local demand for diverse massage therapies in Bellingham, WA.
More salary data for Bellingham, WA:
Frequently Asked Questions
How much do massage therapists make in Bellingham, WA in 2026?
Is Bellingham, WA a good place to work as a massage therapist?
Can massage therapists make $100K in Bellingham?
What is the cost-of-living adjusted massage therapist salary in Bellingham?
How much does a massage therapist make per hour in Bellingham?
Related Pages
Compare Salaries
Career Resources
Nearby Cities in Washington
Written by Jordan Lee, LMT
Career Analyst
Jordan Lee has 10 years of experience in massage therapy. They specialize in sports massage. They work in a wellness center.
Methodology & Data Source
Salary figures on this page are 2026 projections based on the Bureau of Labor Statistics Occupational Employment and Wage Statistics (OEWS) survey, May 2026 release. The BLS reported a median annual salary of $83,790 for massage therapistsin the Bellingham metropolitan area. A 6.03% compound annual growth rate (CAGR), calculated from 6-year national BLS wage trends, was applied to project current 2026 compensation. Percentile ranges (P10–P90) represent the full salary distribution across experience levels and practice settings in this market.
Data Sources & Methodology
Source: BLS, OEWS, 7-year dataset (–). Per-city data from annual BLS metropolitan area surveys.
2026 figures are projected from 2025 BLS data using a compound annual growth rate (CAGR) of 6.03%, derived from historical BLS wage trends for massage therapists (SOC 31-9011).
Compiled and verified by Jordan Lee, LMT, a licensed massage therapist with 10+ years of clinical experience. · View source data at BLS.gov