Massage Therapist Salary in Richmond, VA: $61,211 (2026)
Quick Answer:A full-time massage therapist in Richmond, VA earns a median $61,211/year (≈ $29.42/hour) in nominal terms for 2026 — projected from BLS OEWS 2025 (SOC 31-9011). Once you factor in Richmond's price level (2% below national, BEA RPP 97.9), that paycheck buys what $62,551 would nationally. Nominal pay sits 4.3% below the Virginia state average.
Official BLS data · View source
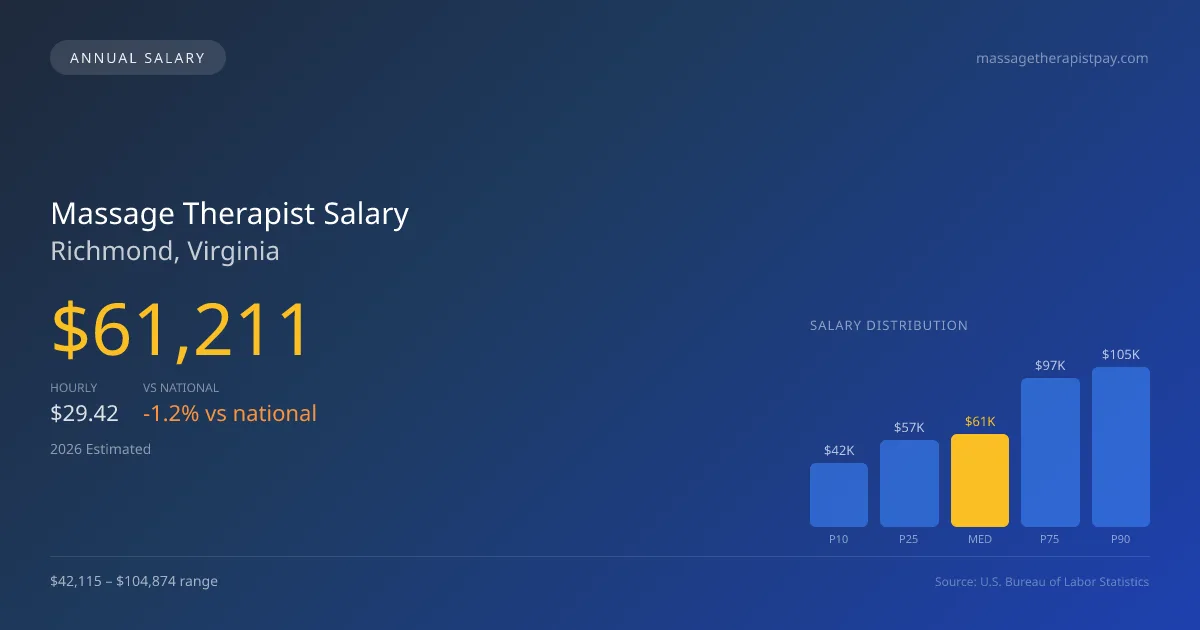
In Richmond, Virginia, the projected median salary for massage therapists in 2026 is estimated at $61,211, closely trailing the national median of $61,975. With income opportunities ranging from $42,115 at the lower end (P10) to as high as $104,874 (P90), the market presents a considerable spectrum of earning potential. This data, derived from official Bureau of Labor Statistics (BLS) OEWS surveys, reflects a growing sector with a 6.03% annual growth rate anticipated over the next five years. Despite this promising outlook, massage therapists in Richmond may find that tip income at local spa employers can significantly enhance overall earnings, an important factor to consider when evaluating job prospects in this city.
Salary Breakdown
| Percentile | Annual | Hourly |
|---|---|---|
| Entry Level (P10) | $42,115 | $20.24 |
| Lower Range (P25) | $57,118 | $27.46 |
| Median (P50)(typical) | $61,211 | $29.42 |
| Upper Range (P75) | $97,367 | $46.81 |
| Top Earners (P90) | $104,874 | $50.43 |
Median Salary Position
1.23% below the national average
2026 Salary Percentile Distribution in Richmond
In Richmond, VA, the massage therapist salary spread from the 10th to 90th percentile is $62,759 (2026 est.). At $61,211, the local median is 1.23% below the national median of $61,975.
Salary Calculator
At 40 hours/week in Richmond: You'd be in the lower-middle range
How Richmond Massage Therapist Pay Compares
Richmond median: $61,211/year (2026)
| Compared To | Median Salary | Richmond Pays |
|---|---|---|
| Virginia Average | $63,961 | -4.30% less |
| National Average | $61,975 | -1.23% less |
Massage Therapists in Richmond, VA earn a median of $61,211 per year (2026 est.), which is 1.23% lower than the national median of $61,975 and 4.30% below the Virginia state average of $63,961.
Cost-of-Living Adjusted Salary
Richmond has a cost of living 2.14% below the national average, meaning your salary goes further here.
Adjusted salary = nominal × (100 / CoL index). CoL index: 100 = national average.
Richmond, VA has a cost-of-living index of 97.858 (below the national average of 100). A massage therapist earning $61,211 nominally has purchasing power equivalent to $62,551 in an average-cost city — an effective 2.19% boost.
Compare Purchasing Power
Select a city to see how your salary compares after cost of living
Select a city above to compare purchasing power
2019 BLS Actual
$37,670
2025 BLS Actual
$57,730
2026 Current Est.
$61,211
2019–2027 Growth
+72.3%
Salary Trajectory for Massage Therapists in Richmond (2019–2027)
2019–2025: actual BLS OEWS data for this metro area. 2026+: CAGR 6.03% projection.
| Year | Annual Salary | Status |
|---|---|---|
| 2019 | $37,670 | Actual |
| 2020 | $37,480 | Actual |
| 2021 | $40,930 | Actual |
| 2022 | $53,050 | Actual |
| 2023 | $49,850 | Actual |
| 2024 | $53,030 | Actual |
| 2025 | $57,730 | Actual |
| 2026(current) | $61,211 | Estimated |
| 2027 | $64,902 | Projected |
Based on 7 years of BLS OEWS data for the Richmond metropolitan area, the median massage therapist salary grew 53.3% from $37,670 (2019) to $57,730 (2025). At a 6.03% compound annual growth rate, salaries are projected to reach $64,902 by 2027 — a total increase of $27,232 (72.29%) from 2019.
Note: Historical values (2019–2025) are actual BLS OEWS figures for the Richmond metropolitan area, sourced from annual Occupational Employment and Wage Statistics surveys. 2026–2026 figures are current estimates, and 2027 values are projections, calculated using a 6.03% CAGR derived from 7-year BLS historical data. Actual salaries may vary based on employer, experience, certifications, and local market conditions.
Salary by Experience Level
| Experience | Estimated Salary Range |
|---|---|
| 0-2 years (New Graduate) | $42,115 – $57,118 |
| 3-5 years (Mid Career) | $57,118 – $61,211 |
| 5+ years (Experienced) | $61,211 – $97,367 |
| 10+ years (Top Earner) | $97,367 – $104,874 |
LMT salary ranges estimated from BLS percentile data. Individual massage therapist compensation varies by employer, certifications, and specialization.
Massage Therapist Job Market in Richmond
Across Richmond, the employment landscape for massage therapists features approximately 490 professionals, indicating a robust local job market. The cost of living index in the area stands at 97.858, suggesting that while salaries are competitive, the purchasing power may be modest relative to other metropolitan areas. Among the employers in the region, chiropractic and physical therapy clinics typically offer higher pay than chains like Massage Envy and Hand & Stone, where pay-per-service rates are lower but predictability in client bookings can appeal to some therapists. The income disparity can be attributed to various factors, including specialization in fields like oncology or sports therapy, which command premium prices, as well as the difference between self-employed rates and those set by employed structures. Therapists interested in maximizing their pay in Richmond should consider focusing on niche areas or building a loyal client base in private practice, balancing the freedom of self-employment with the benefits of consistent bookings offered by establishments.
More salary data for Richmond, VA:
Frequently Asked Questions
How much do massage therapists make in Richmond, VA in 2026?
Is Richmond, VA a good place to work as a massage therapist?
Can massage therapists make $100K in Richmond?
What is the cost-of-living adjusted massage therapist salary in Richmond?
How much does a massage therapist make per hour in Richmond?
Related Pages
Compare Salaries
Career Resources
Nearby Cities in Virginia
Written by Jordan Lee, LMT
Career Analyst
Jordan Lee has 10 years of experience in massage therapy. They specialize in sports massage. They work in a wellness center.
Methodology & Data Source
Salary figures on this page are 2026 projections based on the Bureau of Labor Statistics Occupational Employment and Wage Statistics (OEWS) survey, May 2026 release. The BLS reported a median annual salary of $57,730 for massage therapistsin the Richmond metropolitan area. A 6.03% compound annual growth rate (CAGR), calculated from 6-year national BLS wage trends, was applied to project current 2026 compensation. Percentile ranges (P10–P90) represent the full salary distribution across experience levels and practice settings in this market.
Data Sources & Methodology
Source: BLS, OEWS, 7-year dataset (–). Per-city data from annual BLS metropolitan area surveys.
2026 figures are projected from 2025 BLS data using a compound annual growth rate (CAGR) of 6.03%, derived from historical BLS wage trends for massage therapists (SOC 31-9011).
Compiled and verified by Jordan Lee, LMT, a licensed massage therapist with 10+ years of clinical experience. · View source data at BLS.gov