Massage Therapist Salary in Reno, NV: $50,428 (2026)
Quick Answer:A full-time massage therapist in Reno, NV earns a median $50,428/year (≈ $24.24/hour) in nominal terms for 2026 — projected from BLS OEWS 2025 (SOC 31-9011). Once you factor in Reno's price level (1% above national, BEA RPP 101.0), that paycheck buys what $49,922 would nationally. Nominal pay sits 17.2% below the Nevada state average.
Official BLS data · View source
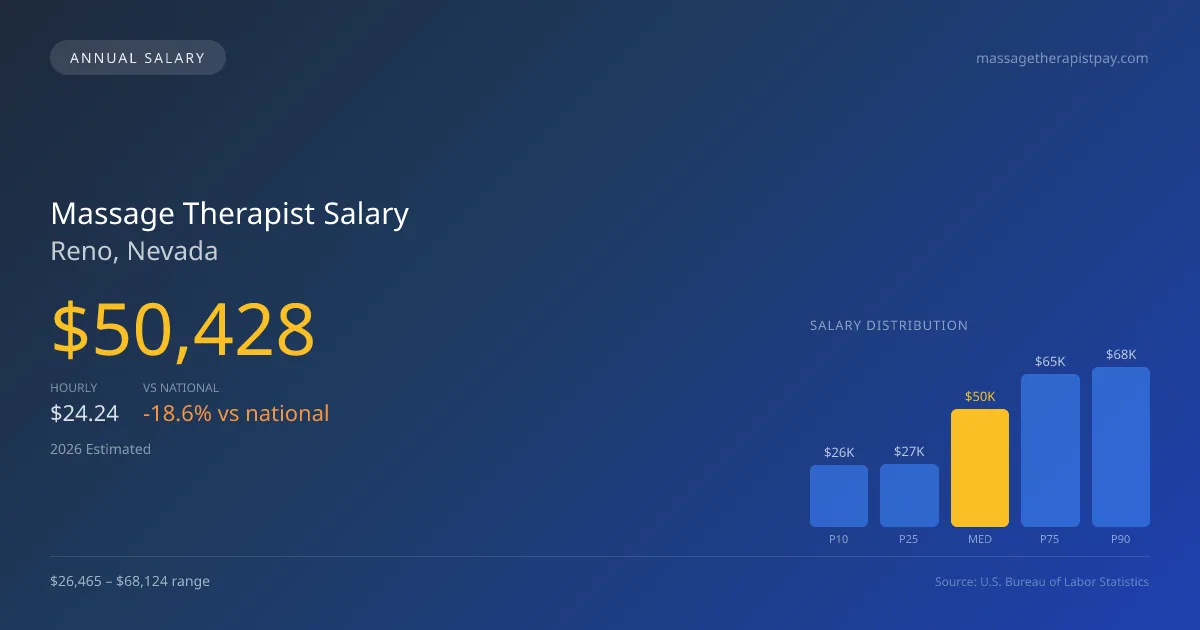
Massage therapists in Reno, NV can expect a median annual salary of $50,428 in 2026, which reflects the nuances of the local job market compared to the national median of $61,975. The salary range for this profession in the area extends from $26,465 for the lower 10th percentile to $68,124 for the top 90th percentile. These figures, derived from official BLS OEWS surveys, showcase the potential for self-employed therapists to earn considerably more than their employed counterparts, although they must also navigate the challenges of overhead costs and self-marketing. Reno's job market remains competitive, with approximately 200 massage therapists currently working in the area, making it essential for professionals to differentiate themselves to maximize their earnings.
Salary Breakdown
| Percentile | Annual | Hourly |
|---|---|---|
| Entry Level (P10) | $26,465 | $12.72 |
| Lower Range (P25) | $26,751 | $12.86 |
| Median (P50)(typical) | $50,428 | $24.24 |
| Upper Range (P75) | $65,071 | $31.28 |
| Top Earners (P90) | $68,124 | $32.75 |
Median Salary Position
18.63% below the national average
2026 Salary Percentile Distribution in Reno
In Reno, NV, the massage therapist salary spread from the 10th to 90th percentile is $41,659 (2026 est.). At $50,428, the local median is 18.63% below the national median of $61,975.
Salary Calculator
At 40 hours/week in Reno: You'd be above the median
How Reno Massage Therapist Pay Compares
Reno median: $50,428/year (2026)
| Compared To | Median Salary | Reno Pays |
|---|---|---|
| Nevada Average | $60,903 | -17.20% less |
| National Average | $61,975 | -18.63% less |
Massage Therapists in Reno, NV earn a median of $50,428 per year (2026 est.), which is 18.63% lower than the national median of $61,975 and 17.20% below the Nevada state average of $60,903.
Cost-of-Living Adjusted Salary
Reno has a cost of living 1.01% above the national average.
Adjusted salary = nominal × (100 / CoL index). CoL index: 100 = national average.
Reno, NV has a cost-of-living index of 101.014 (above the national average of 100). While the nominal salary of $50,428 is competitive, the higher cost of living reduces purchasing power to an effective $49,922 — a 1% reduction.
Compare Purchasing Power
Select a city to see how your salary compares after cost of living
Select a city above to compare purchasing power
2019 BLS Actual
$19,410
2025 BLS Actual
$47,560
2026 Current Est.
$50,428
2019–2027 Growth
+175.5%
Salary Trajectory for Massage Therapists in Reno (2019–2027)
2019–2025: actual BLS OEWS data for this metro area. 2026+: CAGR 6.03% projection.
| Year | Annual Salary | Status |
|---|---|---|
| 2019 | $19,410 | Actual |
| 2020 | $30,100 | Actual |
| 2021 | $29,600 | Actual |
| 2022 | $35,930 | Actual |
| 2023 | $44,320 | Actual |
| 2024 | $47,690 | Actual |
| 2025 | $47,560 | Actual |
| 2026(current) | $50,428 | Estimated |
| 2027 | $53,469 | Projected |
Based on 7 years of BLS OEWS data for the Reno metropolitan area, the median massage therapist salary grew 145.0% from $19,410 (2019) to $47,560 (2025). At a 6.03% compound annual growth rate, salaries are projected to reach $53,469 by 2027 — a total increase of $34,059 (175.47%) from 2019.
Note: Historical values (2019–2025) are actual BLS OEWS figures for the Reno metropolitan area, sourced from annual Occupational Employment and Wage Statistics surveys. 2026–2026 figures are current estimates, and 2027 values are projections, calculated using a 6.03% CAGR derived from 7-year BLS historical data. Actual salaries may vary based on employer, experience, certifications, and local market conditions.
Salary by Experience Level
| Experience | Estimated Salary Range |
|---|---|
| 0-2 years (New Graduate) | $26,465 – $26,751 |
| 3-5 years (Mid Career) | $26,751 – $50,428 |
| 5+ years (Experienced) | $50,428 – $65,071 |
| 10+ years (Top Earner) | $65,071 – $68,124 |
LMT salary ranges estimated from BLS percentile data. Individual massage therapist compensation varies by employer, certifications, and specialization.
Massage Therapist Job Market in Reno
In a city where the cost-of-living index sits just above the national average at 101.014, the take-home purchasing power for massage therapists can vary significantly based on employment type. Those employed at high-end spas, chiropractic clinics, or hospital integrative medicine programs typically enjoy better compensation than those at franchise chains like Massage Envy or Hand & Stone, which often offer lower rates but provide steady client bookings. The salary disparity reflects factors such as tips—commonly 15-25% of the service fee—specialty services like sports or oncology massage which command higher rates, and the self-employed earning potential, which allows top therapists to market themselves effectively. Therefore, aspiring professionals should aim for niche certifications and consider the benefits of building their own practice to maximize their massage therapist salary in Reno, ultimately ensuring sustainable financial growth in this vibrant market.
More salary data for Reno, NV:
Frequently Asked Questions
How much do massage therapists make in Reno, NV in 2026?
Is Reno, NV a good place to work as a massage therapist?
Can massage therapists make $100K in Reno?
What is the cost-of-living adjusted massage therapist salary in Reno?
How much does a massage therapist make per hour in Reno?
Related Pages
Compare Salaries
Career Resources
Nearby Cities in Nevada
Written by Jordan Lee, LMT
Career Analyst
Jordan Lee has 10 years of experience in massage therapy. They specialize in sports massage. They work in a wellness center.
Methodology & Data Source
Salary figures on this page are 2026 projections based on the Bureau of Labor Statistics Occupational Employment and Wage Statistics (OEWS) survey, May 2026 release. The BLS reported a median annual salary of $47,560 for massage therapistsin the Reno metropolitan area. A 6.03% compound annual growth rate (CAGR), calculated from 6-year national BLS wage trends, was applied to project current 2026 compensation. Percentile ranges (P10–P90) represent the full salary distribution across experience levels and practice settings in this market.
Data Sources & Methodology
Source: BLS, OEWS, 7-year dataset (–). Per-city data from annual BLS metropolitan area surveys.
2026 figures are projected from 2025 BLS data using a compound annual growth rate (CAGR) of 6.03%, derived from historical BLS wage trends for massage therapists (SOC 31-9011).
Compiled and verified by Jordan Lee, LMT, a licensed massage therapist with 10+ years of clinical experience. · View source data at BLS.gov