Massage Therapist Salary in Richmond, KY: $54,493 (2026)
Quick Answer:A full-time massage therapist in Richmond, KY earns a median $54,493/year (≈ $26.20/hour) in nominal terms for 2026 — projected from BLS OEWS 2025 (SOC 31-9011). Once you factor in Richmond's price level (11% below national, BEA RPP 89.3), that paycheck buys what $61,022 would nationally. Nominal pay sits 1.5% below the Kentucky state average.
Based on BLS state-level estimates · View source
In 2026, the projected median annual salary for massage therapists in Richmond, KY, stands at $54,493, trailing the national median of $61,975 by approximately 12%. This local figure reflects a salary range where the lower 10% earn around $31,606, while the top 90% can command up to $84,465. These estimates, drawn from 2025 BLS data and adjusted for regional costs, indicate that while working as a employed therapist offers some stability, self-employed professionals have the potential to significantly boost their earnings by charging on a cash-pay basis. However, they must manage overhead costs and marketing efforts independently to capitalize on this opportunity.
About the Richmond Market
Salary estimated from Kentucky average ($42,000) adjusted for local cost of living.
Salary Breakdown
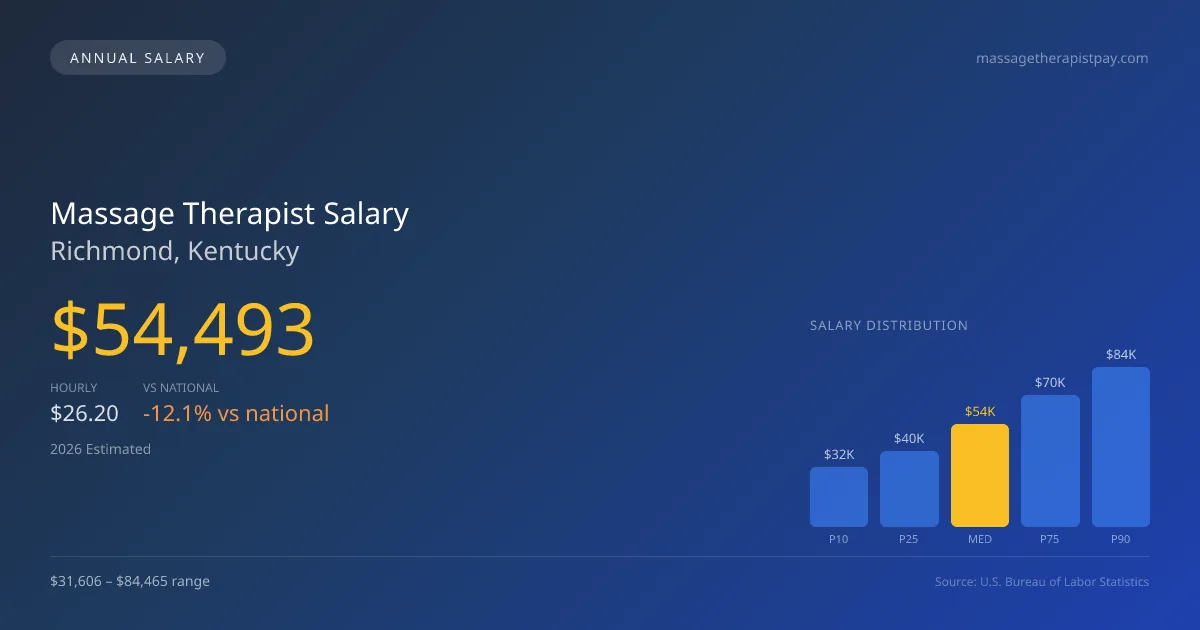
| Percentile | Annual | Hourly |
|---|---|---|
| Entry Level (P10) | $31,606 | $15.19 |
| Lower Range (P25) | $40,237 | $19.34 |
| Median (P50)(typical) | $54,493 | $26.20 |
| Upper Range (P75) | $69,751 | $33.54 |
| Top Earners (P90) | $84,465 | $40.61 |
Median Salary Position
12.07% below the national average
2026 Salary Percentile Distribution in Richmond
In Richmond, KY, the massage therapist salary spread from the 10th to 90th percentile is $52,859 (2026 est.). At $54,493, the local median is 12.07% below the national median of $61,975.
Salary Calculator
At 40 hours/week in Richmond: You'd be in the lower-middle range
How Richmond Massage Therapist Pay Compares
Richmond median: $54,493/year (2026)
| Compared To | Median Salary | Richmond Pays |
|---|---|---|
| Kentucky Average | $55,323 | -1.50% less |
| National Average | $61,975 | -12.07% less |
Massage Therapists in Richmond, KY earn a median of $54,493 per year (2026 est.), which is 12.07% lower than the national median of $61,975 and 1.50% below the Kentucky state average of $55,323.
Cost-of-Living Adjusted Salary
Richmond has a cost of living 10.70% below the national average, meaning your salary goes further here.
Adjusted salary = nominal × (100 / CoL index). CoL index: 100 = national average.
Richmond, KY has a cost-of-living index of 89.3 (below the national average of 100). A massage therapist earning $54,493 nominally has purchasing power equivalent to $61,022 in an average-cost city — an effective 11.98% boost.
Compare Purchasing Power
Select a city to see how your salary compares after cost of living
Select a city above to compare purchasing power
2019 BLS Actual
$37,651
2025 BLS Actual
$51,394
2026 Current Est.
$54,493
2019–2027 Growth
+53.5%
Salary Trajectory for Massage Therapists in Richmond (2019–2027)
2019–2025: actual BLS OEWS data for this metro area. 2026+: CAGR 6.03% projection.
| Year | Annual Salary | Status |
|---|---|---|
| 2019 | $37,651 | Actual |
| 2020 | $38,354 | Actual |
| 2021 | $41,247 | Actual |
| 2022 | $43,841 | Actual |
| 2023 | $48,633 | Actual |
| 2024 | $36,929 | Actual |
| 2025 | $51,394 | Actual |
| 2026(current) | $54,493 | Estimated |
| 2027 | $57,779 | Projected |
Based on 7 years of BLS OEWS data for the Richmond metropolitan area, the median massage therapist salary grew 36.5% from $37,651 (2019) to $51,394 (2025). At a 6.03% compound annual growth rate, salaries are projected to reach $57,779 by 2027 — a total increase of $20,128 (53.46%) from 2019.
Note: Historical values (2019–2025) are actual BLS OEWS figures for the Richmond metropolitan area, sourced from annual Occupational Employment and Wage Statistics surveys. 2026–2026 figures are current estimates, and 2027 values are projections, calculated using a 6.03% CAGR derived from 7-year BLS historical data. Actual salaries may vary based on employer, experience, certifications, and local market conditions.
Salary by Experience Level
| Experience | Estimated Salary Range |
|---|---|
| 0-2 years (New Graduate) | $31,606 – $40,237 |
| 3-5 years (Mid Career) | $40,237 – $54,493 |
| 5+ years (Experienced) | $54,493 – $69,751 |
| 10+ years (Top Earner) | $69,751 – $84,465 |
LMT salary ranges estimated from BLS percentile data. Individual massage therapist compensation varies by employer, certifications, and specialization.
Massage Therapist Job Market in Richmond
With only five massage therapists employed in Richmond, job market competition is light, potentially creating a community feeling among professionals. Given the cost of living index at 89.3, the buying power for these salaries is somewhat favorable compared to national averages, allowing local therapists to maintain a decent standard of living. Spas tend to offer some of the highest pay, especially upscale ones that appeal to clientele willing to pay a premium. However, the income gap between employed and self-employed massage therapists can be considerable; many self-employed practitioners can charge $80-$150 per hour directly from clients. Therapists specializing in areas like sports, prenatal therapy, or oncology may also find opportunities for higher pay. To maximize earnings in Richmond, developing a strong client base through effective self-promotion while considering specialization could enhance overall income potential.
More salary data for Richmond, KY:
Frequently Asked Questions
How much do massage therapists make in Richmond, KY in 2026?
Is Richmond, KY a good place to work as a massage therapist?
Can massage therapists make $100K in Richmond?
What is the cost-of-living adjusted massage therapist salary in Richmond?
How much does a massage therapist make per hour in Richmond?
Related Pages
Compare Salaries
Career Resources
Written by Jordan Lee, LMT
Career Analyst
Jordan Lee has 10 years of experience in massage therapy. They specialize in sports massage. They work in a wellness center.
Methodology & Data Source
Salary figures on this page are 2026 projections based on the Bureau of Labor Statistics Occupational Employment and Wage Statistics (OEWS) survey, May 2026 release. The BLS reported a median annual salary of $51,394 for massage therapistsin the Richmond metropolitan area. A 6.03% compound annual growth rate (CAGR), calculated from 6-year national BLS wage trends, was applied to project current 2026 compensation. Percentile ranges (P10–P90) represent the full salary distribution across experience levels and practice settings in this market.
Data Sources & Methodology
Salary data for Richmond is estimated from official BLS state-level occupational wage data (2025), adjusted for regional cost-of-living differences using BEA RPP (Regional Price Parities).
2026 figures are projected from 2025 BLS data using a compound annual growth rate (CAGR) of 6.03%, derived from historical BLS wage trends for massage therapists (SOC 31-9011).
Compiled and verified by Jordan Lee, LMT, a licensed massage therapist with 10+ years of clinical experience. · View source data at BLS.gov