Massage Therapist Salary in Richmond, IN: $55,218 (2026)
Quick Answer:A full-time massage therapist in Richmond, IN earns a median $55,218/year (≈ $26.55/hour) in nominal terms for 2026 — projected from BLS OEWS 2025 (SOC 31-9011). Once you factor in Richmond's price level (9% below national, BEA RPP 91.3), that paycheck buys what $60,480 would nationally. Nominal pay sits 2.7% below the Indiana state average.
Based on BLS state-level estimates · View source
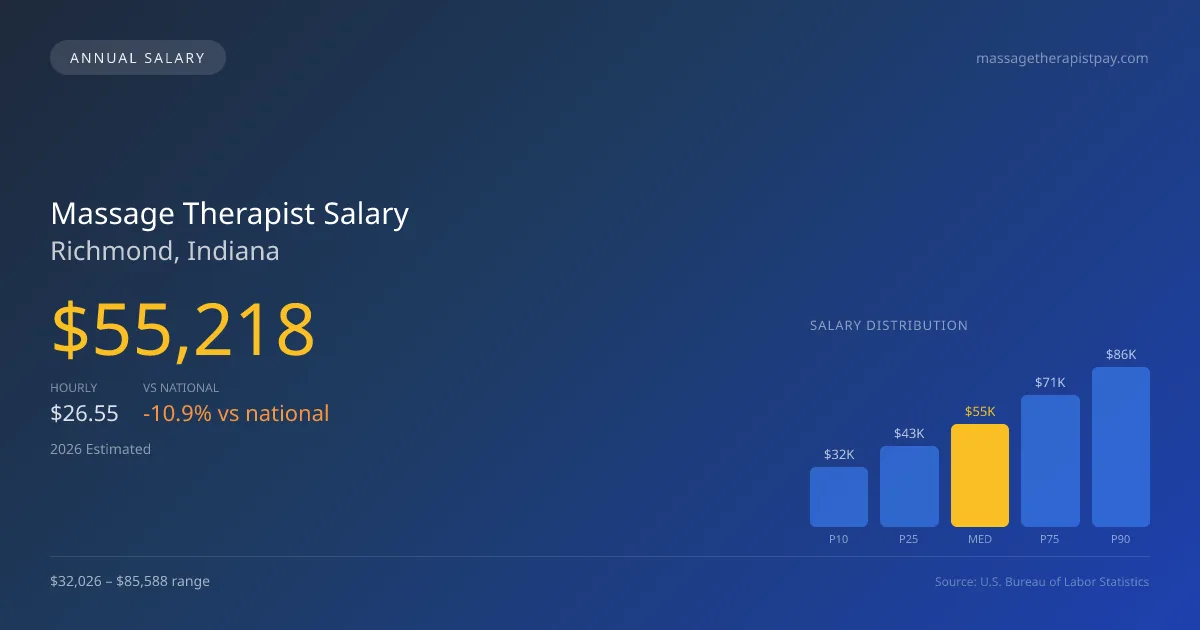
In Richmond, Indiana, the projected median annual salary for massage therapists in 2026 is $55,218, which reflects a notable difference from the national median of $61,975. The local salary range spans from $32,026 at the 10th percentile to $85,588 at the 90th percentile. These estimates, derived from 2025 BLS data adjusted for regional price variations, highlight Richmond's unique economic landscape. Additionally, many massage therapists working in spas gain income through tips, which can significantly enhance their overall earnings. Given the local market conditions, understanding the intricacies of compensation can provide valuable insight for aspiring and established massage therapists in Richmond, IN.
About the Richmond Market
Salary estimated from Indiana average ($44,000) adjusted for local cost of living.
Salary Breakdown
| Percentile | Annual | Hourly |
|---|---|---|
| Entry Level (P10) | $32,026 | $15.40 |
| Lower Range (P25) | $43,340 | $20.83 |
| Median (P50)(typical) | $55,218 | $26.55 |
| Upper Range (P75) | $70,680 | $33.98 |
| Top Earners (P90) | $85,588 | $41.15 |
Median Salary Position
10.9% below the national average
2026 Salary Percentile Distribution in Richmond
In Richmond, IN, the massage therapist salary spread from the 10th to 90th percentile is $53,562 (2026 est.). At $55,218, the local median is 10.9% below the national median of $61,975.
Salary Calculator
At 40 hours/week in Richmond: You'd be in the lower-middle range
How Richmond Massage Therapist Pay Compares
Richmond median: $55,218/year (2026)
| Compared To | Median Salary | Richmond Pays |
|---|---|---|
| Indiana Average | $56,751 | -2.70% less |
| National Average | $61,975 | -10.90% less |
Massage Therapists in Richmond, IN earn a median of $55,218 per year (2026 est.), which is 10.90% lower than the national median of $61,975 and 2.70% below the Indiana state average of $56,751.
Cost-of-Living Adjusted Salary
Richmond has a cost of living 8.70% below the national average, meaning your salary goes further here.
Adjusted salary = nominal × (100 / CoL index). CoL index: 100 = national average.
Richmond, IN has a cost-of-living index of 91.3 (below the national average of 100). A massage therapist earning $55,218 nominally has purchasing power equivalent to $60,480 in an average-cost city — an effective 9.53% boost.
Compare Purchasing Power
Select a city to see how your salary compares after cost of living
Select a city above to compare purchasing power
2019 BLS Actual
$38,152
2025 BLS Actual
$52,078
2026 Current Est.
$55,218
2019–2027 Growth
+53.5%
Salary Trajectory for Massage Therapists in Richmond (2019–2027)
2019–2025: actual BLS OEWS data for this metro area. 2026+: CAGR 6.03% projection.
| Year | Annual Salary | Status |
|---|---|---|
| 2019 | $38,152 | Actual |
| 2020 | $38,865 | Actual |
| 2021 | $41,796 | Actual |
| 2022 | $44,424 | Actual |
| 2023 | $49,280 | Actual |
| 2024 | $39,093 | Actual |
| 2025 | $52,078 | Actual |
| 2026(current) | $55,218 | Estimated |
| 2027 | $58,548 | Projected |
Based on 7 years of BLS OEWS data for the Richmond metropolitan area, the median massage therapist salary grew 36.5% from $38,152 (2019) to $52,078 (2025). At a 6.03% compound annual growth rate, salaries are projected to reach $58,548 by 2027 — a total increase of $20,396 (53.46%) from 2019.
Note: Historical values (2019–2025) are actual BLS OEWS figures for the Richmond metropolitan area, sourced from annual Occupational Employment and Wage Statistics surveys. 2026–2026 figures are current estimates, and 2027 values are projections, calculated using a 6.03% CAGR derived from 7-year BLS historical data. Actual salaries may vary based on employer, experience, certifications, and local market conditions.
Salary by Experience Level
| Experience | Estimated Salary Range |
|---|---|
| 0-2 years (New Graduate) | $32,026 – $43,340 |
| 3-5 years (Mid Career) | $43,340 – $55,218 |
| 5+ years (Experienced) | $55,218 – $70,680 |
| 10+ years (Top Earner) | $70,680 – $85,588 |
LMT salary ranges estimated from BLS percentile data. Individual massage therapist compensation varies by employer, certifications, and specialization.
Massage Therapist Job Market in Richmond
With only seven massage therapists currently employed in Richmond, the competition is quite limited, but this small pool can also create opportunities for motivated practitioners. The cost-of-living index stands at 91.3, indicating that the purchasing power for massage therapist pay in Richmond, IN, is slightly below the national average. Among local employers, franchise chains like Massage Envy and Hand & Stone typically offer lower pay compared to independent practices, while chiropractic clinics and hospital-based programs may provide more stable employment options. The disparity between low and high wages often stems from a variety of factors, including the self-employed versus employed model, specialty training, and tip income from high-end spa services. To maximize earnings in Richmond's market, therapists should consider building a loyal client base, specializing in niche services, and leveraging social media for marketing, as cash-paying self-employed practitioners have the potential to earn substantially higher rates per session, despite additional responsibilities for their own business operations.
More salary data for Richmond, IN:
Frequently Asked Questions
How much do massage therapists make in Richmond, IN in 2026?
Is Richmond, IN a good place to work as a massage therapist?
Can massage therapists make $100K in Richmond?
What is the cost-of-living adjusted massage therapist salary in Richmond?
How much does a massage therapist make per hour in Richmond?
Related Pages
Compare Salaries
Career Resources
Nearby Cities in Indiana
Written by Jordan Lee, LMT
Career Analyst
Jordan Lee has 10 years of experience in massage therapy. They specialize in sports massage. They work in a wellness center.
Methodology & Data Source
Salary figures on this page are 2026 projections based on the Bureau of Labor Statistics Occupational Employment and Wage Statistics (OEWS) survey, May 2026 release. The BLS reported a median annual salary of $52,078 for massage therapistsin the Richmond metropolitan area. A 6.03% compound annual growth rate (CAGR), calculated from 6-year national BLS wage trends, was applied to project current 2026 compensation. Percentile ranges (P10–P90) represent the full salary distribution across experience levels and practice settings in this market.
Data Sources & Methodology
Salary data for Richmond is estimated from official BLS state-level occupational wage data (2025), adjusted for regional cost-of-living differences using BEA RPP (Regional Price Parities).
2026 figures are projected from 2025 BLS data using a compound annual growth rate (CAGR) of 6.03%, derived from historical BLS wage trends for massage therapists (SOC 31-9011).
Compiled and verified by Jordan Lee, LMT, a licensed massage therapist with 10+ years of clinical experience. · View source data at BLS.gov