Massage Therapist Salary in District of Columbia: $69,153 (2026)
Quick Answer:Across District of Columbia's 1 metropolitan areas, the average median massage therapist pay sits at $69,153/year heading into 2026 — a figure projected from 2025 BLS OEWS wage data for SOC 31-9011. Because District of Columbia sits at BEA RPP 117.0 (17% above the U.S. baseline), that statewide median translates to roughly $59,105 in nationally-comparable purchasing power. Highest-paying metros: Washington ($65,220).
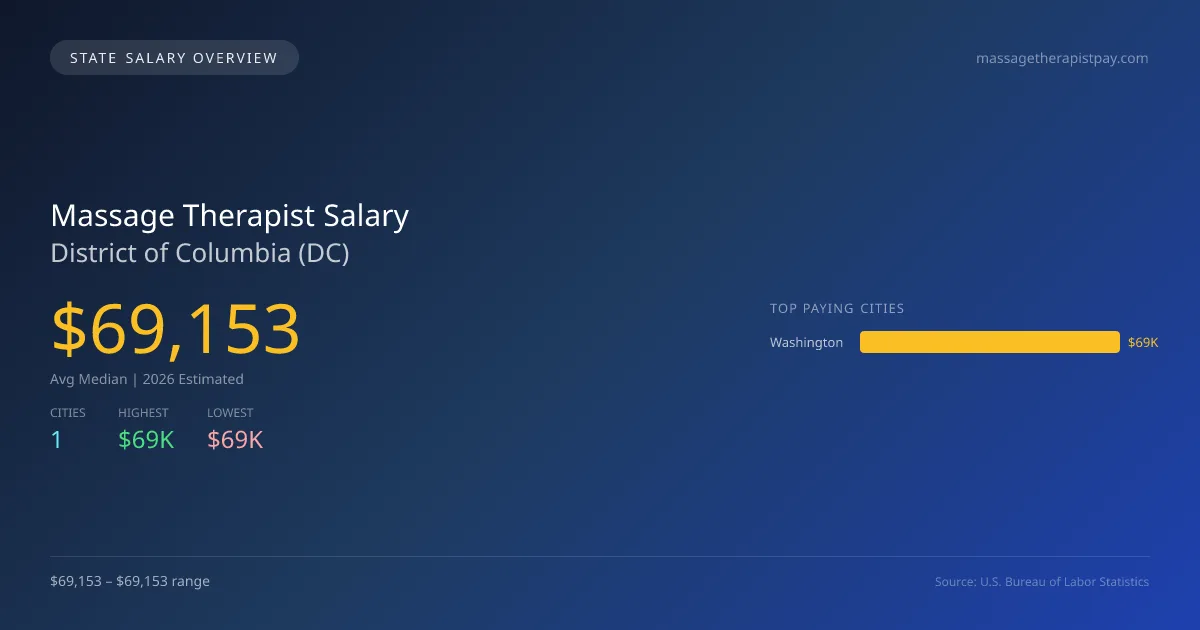
In 2026, the average median salary for massage therapists in the District of Columbia is projected to be $69,153, which is significantly higher than the national median of $61,975, marking an 11.6% increase. Washington, DC is the sole metro area, with all 1,540 employed massage therapists earning the same projected average of $69,153. This consistency in salary across the city suggests a steady demand for skilled professionals, likely driven by the metropolitan area's high cost of living and a focus on wellness services. District-specific factors include unique licensing requirements, where practitioners must complete specific education and training programs approved by the DC Board of Massage Therapy. The scope of practice is also clearly defined, impacting job opportunities and roles within the industry. The expected job market growth rate is approximately 6.03% annually, indicating an expanding field that may attract new entrants. Overall, the favorable salary, solid growth rate, and stable employment levels position massage therapy as a viable career path in the District of Columbia, making it an appealing option for both current practitioners and those considering entry into the field.
District of Columbia Massage Therapist Salary Range
Overall salary range in District of Columbia: $48,922 (lowest entry-level) to $140,225 (highest top earner)
District of Columbia vs National Average
District of Columbia massage therapists earn 11.58% more than the national median (+$7,178/year difference).
District of Columbia Massage Therapist Salary Distribution (2026)
Massage Therapist salaries in District of Columbia range from $48,922 (entry-level, 10th percentile) to $140,225 (top earners, 90th percentile), with a median of $69,153. The District of Columbia median is $7,178 above the US national median of $61,975. The average hourly rate is $33.25/hr. Approximately 1,540 massage therapists are employed across 1 cities.
2019 BLS Actual
$44,500
2025 BLS Actual
$65,220
2026 Current Est.
$69,153
2019–2027 Growth
+64.8%
Salary Trajectory for Massage Therapists in District of Columbia (2019–2027)
2019–2025: actual BLS OEWS data for this metro area. 2026+: CAGR 6.03% projection.
| Year | Annual Salary | Status |
|---|---|---|
| 2019 | $44,500 | Actual |
| 2020 | $48,280 | Actual |
| 2021 | $48,560 | Actual |
| 2022 | $60,810 | Actual |
| 2023 | $62,230 | Actual |
| 2024 | $62,500 | Actual |
| 2025 | $65,220 | Actual |
| 2026(current) | $69,153 | Estimated |
| 2027 | $73,323 | Projected |
Based on 7 years of BLS OEWS data for the District of Columbia metropolitan area, the median massage therapist salary grew 46.6% from $44,500 (2019) to $65,220 (2025). At a 6.03% compound annual growth rate, salaries are projected to reach $73,323 by 2027 — a total increase of $28,823 (64.77%) from 2019.
Note: Historical values (2019–2025) are actual BLS OEWS figures for the District of Columbia metropolitan area, sourced from annual Occupational Employment and Wage Statistics surveys. 2026–2026 figures are current estimates, and 2027 values are projections, calculated using a 6.03% CAGR derived from 7-year BLS historical data. Actual salaries may vary based on employer, experience, certifications, and local market conditions.
Top 1 Highest Paying Cities in District of Columbia
Salary by Experience Level in District of Columbia
| Experience Level | Estimated Annual |
|---|---|
| Entry Level (0-2 years) | $48,922 |
| Mid Career (3-7 years) | $69,153 |
| Experienced (7+ years) | $140,225 |
Estimates based on BLS percentile data averaged across District of Columbia metro areas. Individual pay varies by employer, certifications, and specialization.
All 1 Cities in District of Columbia
| # | City | Median Salary |
|---|---|---|
| 1 | Washington | $69,153 |
More District of Columbia Salary Data
Explore More Massage Therapist Salary Data
Frequently Asked Questions
How much do massage therapists make in District of Columbia in 2026?
What is the highest paying city for massage therapists in District of Columbia?
How does District of Columbia massage therapist pay compare to the national average?
What is the entry-level massage therapist salary in District of Columbia?
How many massage therapists are employed in District of Columbia?
Which District of Columbia city offers the best value for massage therapists?
Written by Jordan Lee, LMT
Career Analyst
Jordan Lee has 10 years of experience in massage therapy. They specialize in sports massage. They work in a wellness center.
Methodology & Data Source
Statewide salary figures on this page are 2026 projections based on the Bureau of Labor Statistics Occupational Employment and Wage Statistics (OEWS) survey, May 2026 release. A 6.03% compound annual growth rate (CAGR), derived from 6-year national BLS wage trends, was applied to each metro area's reported salary to estimate current 2026 massage therapist compensation across District of Columbia. State averages are employment-weighted across 1 metro areas — larger metro areas with more massage therapistscontribute proportionally more to the average, producing figures that better reflect typical compensation. Individual pay varies by city, employer, certifications, and experience.
Data Sources & Methodology
Source: BLS, OEWS, 7-year dataset (–). Per-city data from annual BLS metropolitan area surveys.
2026 figures are projected from 2025 BLS data using a compound annual growth rate (CAGR) of 6.03%, derived from historical BLS wage trends for massage therapists (SOC 31-9011).
Compiled and verified by Jordan Lee, LMT, a licensed massage therapist with 10+ years of clinical experience. · View source data at BLS.gov