Massage Therapist Salary in San Jose, CA: $53,079 (2026)
Quick Answer:A full-time massage therapist in San Jose, CA earns a median $53,079/year (≈ $25.52/hour) in nominal terms for 2026 — projected from BLS OEWS 2025 (SOC 31-9011). Once you factor in San Jose's price level (10% above national, BEA RPP 110.4), that paycheck buys what $48,069 would nationally. Nominal pay sits 0.2% below the California state average.
Official BLS data · View source
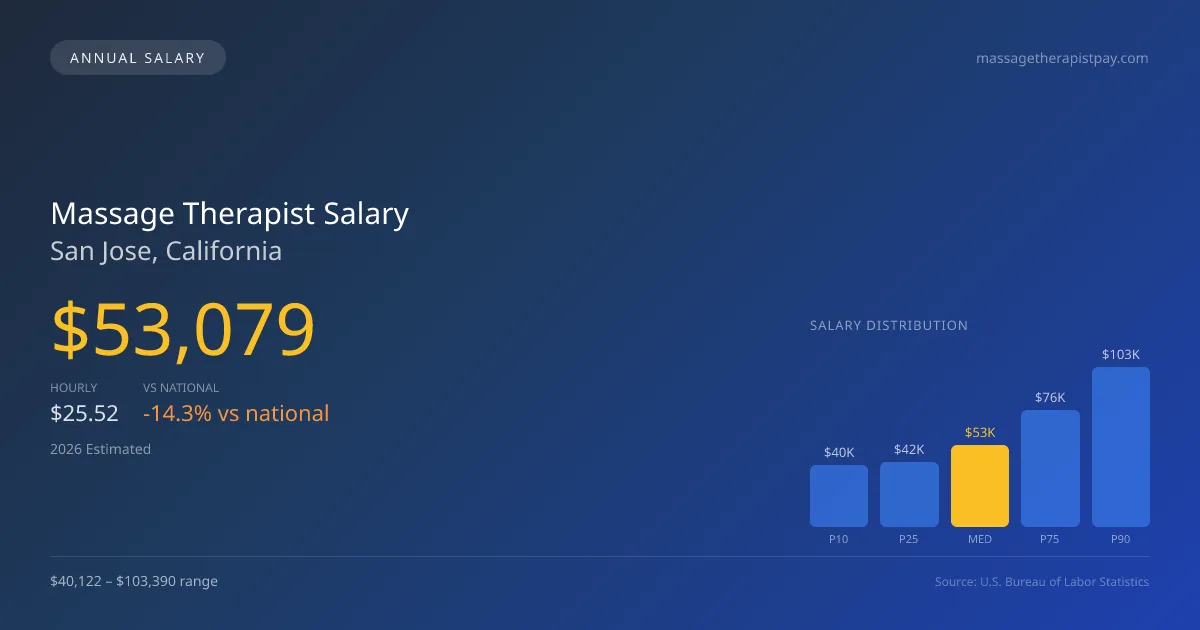
In 2026, the projected median annual salary for massage therapists in San Jose, California is $53,079, which is notably lower than the national median of $61,975, translating to approximately 14.35% less than the national average. The salary range extends from $40,122 at the 10th percentile to a maximum of $103,390 at the 90th percentile, indicating a diverse salary potential based on experience, specialization, and employment settings. This data, derived from BLS OEWS surveys, highlights that while self-employed therapists have the potential to earn significantly more per session—sometimes even clearing $80-$150 in direct pay—they must navigate the responsibilities of overhead costs and marketing. The market in San Jose reflects an environment where massage therapists are challenged not only by income disparities but also by the fluctuating demand for services set against a backdrop of a vibrant local economy.
Salary Breakdown
| Percentile | Annual | Hourly |
|---|---|---|
| Entry Level (P10) | $40,122 | $19.29 |
| Lower Range (P25) | $42,264 | $20.33 |
| Median (P50)(typical) | $53,079 | $25.52 |
| Upper Range (P75) | $75,758 | $36.42 |
| Top Earners (P90) | $103,390 | $49.71 |
Median Salary Position
14.35% below the national average
2026 Salary Percentile Distribution in San Jose
In San Jose, CA, the massage therapist salary spread from the 10th to 90th percentile is $63,268 (2026 est.). At $53,079, the local median is 14.35% below the national median of $61,975.
Salary Calculator
At 40 hours/week in San Jose: You'd be in the entry-level range
How San Jose Massage Therapist Pay Compares
San Jose median: $53,079/year (2026)
| Compared To | Median Salary | San Jose Pays |
|---|---|---|
| California Average | $53,185 | -0.20% less |
| National Average | $61,975 | -14.35% less |
Massage Therapists in San Jose, CA earn a median of $53,079 per year (2026 est.), which is 14.35% lower than the national median of $61,975 and 0.20% below the California state average of $53,185.
Cost-of-Living Adjusted Salary
San Jose has a cost of living 10.42% above the national average.
Adjusted salary = nominal × (100 / CoL index). CoL index: 100 = national average.
San Jose, CA has a cost-of-living index of 110.423 (above the national average of 100). While the nominal salary of $53,079 is competitive, the higher cost of living reduces purchasing power to an effective $48,069 — a 9.44% reduction.
Compare Purchasing Power
Select a city to see how your salary compares after cost of living
Select a city above to compare purchasing power
2019 BLS Actual
$33,480
2025 BLS Actual
$50,060
2026 Current Est.
$53,079
2019–2027 Growth
+68.1%
Salary Trajectory for Massage Therapists in San Jose (2019–2027)
2019–2025: actual BLS OEWS data for this metro area. 2026+: CAGR 6.03% projection.
| Year | Annual Salary | Status |
|---|---|---|
| 2019 | $33,480 | Actual |
| 2020 | $34,100 | Actual |
| 2021 | $57,420 | Actual |
| 2022 | $63,850 | Actual |
| 2023 | $49,100 | Actual |
| 2024 | $56,720 | Actual |
| 2025 | $50,060 | Actual |
| 2026(current) | $53,079 | Estimated |
| 2027 | $56,279 | Projected |
Based on 7 years of BLS OEWS data for the San Jose metropolitan area, the median massage therapist salary grew 49.5% from $33,480 (2019) to $50,060 (2025). At a 6.03% compound annual growth rate, salaries are projected to reach $56,279 by 2027 — a total increase of $22,799 (68.10%) from 2019.
Note: Historical values (2019–2025) are actual BLS OEWS figures for the San Jose metropolitan area, sourced from annual Occupational Employment and Wage Statistics surveys. 2026–2026 figures are current estimates, and 2027 values are projections, calculated using a 6.03% CAGR derived from 7-year BLS historical data. Actual salaries may vary based on employer, experience, certifications, and local market conditions.
Salary by Experience Level
| Experience | Estimated Salary Range |
|---|---|
| 0-2 years (New Graduate) | $40,122 – $42,264 |
| 3-5 years (Mid Career) | $42,264 – $53,079 |
| 5+ years (Experienced) | $53,079 – $75,758 |
| 10+ years (Top Earner) | $75,758 – $103,390 |
LMT salary ranges estimated from BLS percentile data. Individual massage therapist compensation varies by employer, certifications, and specialization.
Massage Therapist Job Market in San Jose
With approximately 680 massage therapists practicing in San Jose, the local job market appears robust, but the cost of living is also a crucial consideration, featuring a cost-of-living index of 110.423. This means that while massage therapist pay in San Jose CA may seem inviting, the higher living expenses can significantly impact take-home pay. Among various employers, high-end spas may offer more competitive wages compared to franchise chains like Massage Envy or Hand & Stone that generally pay lower base rates. Factors contributing to the salary range include the financial differences between self-employed practitioners and those employed in spas or clinics, where tips can also enhance earnings significantly—often ranging from 15% to 25% of the session fee. To maximize income in this competitive region, therapists should consider building a personal brand, specializing in high-demand areas such as sports or prenatal therapy, and fostering strong client relationships to encourage repeat business.
More salary data for San Jose, CA:
Frequently Asked Questions
How much do massage therapists make in San Jose, CA in 2026?
Is San Jose, CA a good place to work as a massage therapist?
Can massage therapists make $100K in San Jose?
What is the cost-of-living adjusted massage therapist salary in San Jose?
How much does a massage therapist make per hour in San Jose?
Related Pages
Compare Salaries
Career Resources
Nearby Cities in California
Written by Jordan Lee, LMT
Career Analyst
Jordan Lee has 10 years of experience in massage therapy. They specialize in sports massage. They work in a wellness center.
Methodology & Data Source
Salary figures on this page are 2026 projections based on the Bureau of Labor Statistics Occupational Employment and Wage Statistics (OEWS) survey, May 2026 release. The BLS reported a median annual salary of $50,060 for massage therapistsin the San Jose metropolitan area. A 6.03% compound annual growth rate (CAGR), calculated from 6-year national BLS wage trends, was applied to project current 2026 compensation. Percentile ranges (P10–P90) represent the full salary distribution across experience levels and practice settings in this market.
Data Sources & Methodology
Source: BLS, OEWS, 7-year dataset (–). Per-city data from annual BLS metropolitan area surveys.
2026 figures are projected from 2025 BLS data using a compound annual growth rate (CAGR) of 6.03%, derived from historical BLS wage trends for massage therapists (SOC 31-9011).
Compiled and verified by Jordan Lee, LMT, a licensed massage therapist with 10+ years of clinical experience. · View source data at BLS.gov