Massage Therapist Salary in Jurupa Valley, CA: $53,313 (2026)
Quick Answer:A full-time massage therapist in Jurupa Valley, CA earns a median $53,313/year (≈ $25.63/hour) in nominal terms for 2026 — projected from BLS OEWS 2025 (SOC 31-9011). Once you factor in Jurupa Valley's price level (13% above national, BEA RPP 113.1), that paycheck buys what $47,138 would nationally. Nominal pay sits 0.3% above the California state average.
Based on BLS state-level estimates · View source
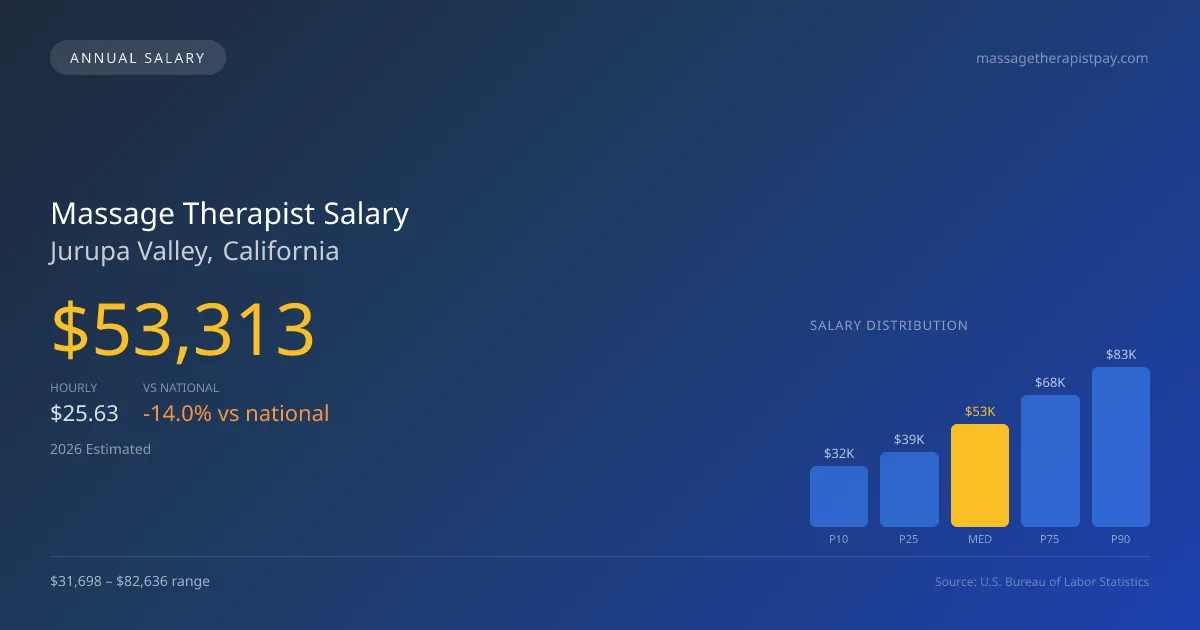
In Jurupa Valley, California, massage therapists earn a median annual salary of $53,313, which falls below the national average of $61,975. The salary range for this profession is quite broad, with the lower 10% earning approximately $31,698 and the top 90% making up to $82,636. These figures are derived from state-level data and adjusted for regional cost variations, reflecting the unique economic landscape of the area. With a relatively small job pool of 24 massage therapists employed in Jurupa Valley, understanding local income potentials becomes crucial for those entering the field or considering a career change.
About the Jurupa Valley Market
Salary estimated from California average ($58,000) adjusted for local cost of living.
Salary Breakdown
| Percentile | Annual | Hourly |
|---|---|---|
| Entry Level (P10) | $31,698 | $15.24 |
| Lower Range (P25) | $38,982 | $18.75 |
| Median (P50)(typical) | $53,313 | $25.63 |
| Upper Range (P75) | $68,241 | $32.81 |
| Top Earners (P90) | $82,636 | $39.73 |
Median Salary Position
13.98% below the national average
2026 Salary Percentile Distribution in Jurupa Valley
In Jurupa Valley, CA, the massage therapist salary spread from the 10th to 90th percentile is $50,938 (2026 est.). At $53,313, the local median is 13.98% below the national median of $61,975.
Salary Calculator
At 40 hours/week in Jurupa Valley: You'd be in the lower-middle range
How Jurupa Valley Massage Therapist Pay Compares
Jurupa Valley median: $53,313/year (2026)
| Compared To | Median Salary | Jurupa Valley Pays |
|---|---|---|
| California Average | $53,153 | +0.30% more |
| National Average | $61,975 | -13.98% less |
Massage Therapists in Jurupa Valley, CA earn a median of $53,313 per year (2026 est.), which is 13.98% lower than the national median of $61,975 and 0.30% above the California state average of $53,153.
Cost-of-Living Adjusted Salary
Jurupa Valley has a cost of living 13.10% above the national average.
Adjusted salary = nominal × (100 / CoL index). CoL index: 100 = national average.
Jurupa Valley, CA has a cost-of-living index of 113.1 (above the national average of 100). While the nominal salary of $53,313 is competitive, the higher cost of living reduces purchasing power to an effective $47,138 — a 11.58% reduction.
Compare Purchasing Power
Select a city to see how your salary compares after cost of living
Select a city above to compare purchasing power
2019 BLS Actual
$36,835
2025 BLS Actual
$50,281
2026 Current Est.
$53,313
2019–2027 Growth
+53.5%
Salary Trajectory for Massage Therapists in Jurupa Valley (2019–2027)
2019–2025: actual BLS OEWS data for this metro area. 2026+: CAGR 6.03% projection.
| Year | Annual Salary | Status |
|---|---|---|
| 2019 | $36,835 | Actual |
| 2020 | $37,524 | Actual |
| 2021 | $40,354 | Actual |
| 2022 | $42,892 | Actual |
| 2023 | $47,580 | Actual |
| 2024 | $65,769 | Actual |
| 2025 | $50,281 | Actual |
| 2026(current) | $53,313 | Estimated |
| 2027 | $56,528 | Projected |
Based on 7 years of BLS OEWS data for the Jurupa Valley metropolitan area, the median massage therapist salary grew 36.5% from $36,835 (2019) to $50,281 (2025). At a 6.03% compound annual growth rate, salaries are projected to reach $56,528 by 2027 — a total increase of $19,693 (53.46%) from 2019.
Note: Historical values (2019–2025) are actual BLS OEWS figures for the Jurupa Valley metropolitan area, sourced from annual Occupational Employment and Wage Statistics surveys. 2026–2026 figures are current estimates, and 2027 values are projections, calculated using a 6.03% CAGR derived from 7-year BLS historical data. Actual salaries may vary based on employer, experience, certifications, and local market conditions.
Salary by Experience Level
| Experience | Estimated Salary Range |
|---|---|
| 0-2 years (New Graduate) | $31,698 – $38,982 |
| 3-5 years (Mid Career) | $38,982 – $53,313 |
| 5+ years (Experienced) | $53,313 – $68,241 |
| 10+ years (Top Earner) | $68,241 – $82,636 |
LMT salary ranges estimated from BLS percentile data. Individual massage therapist compensation varies by employer, certifications, and specialization.
Massage Therapist Job Market in Jurupa Valley
The cost of living in Jurupa Valley, indicated by a cost-of-living index of 113.1, suggests that while salaries appear lower than the national average, the purchasing power may be impacted by local expenses. Spas and franchise chains like Massage Envy and Hand & Stone typically offer lower pay structures compared to self-employed practices, where therapists can set their rates and potentially earn between $80 and $150 per session, although they must handle their marketing and overhead costs. Specialized services such as prenatal or sports massages can yield higher returns. To maximize earnings, massage therapists in Jurupa Valley should consider branching into self-employment or building a strong clientele through specialty services, while being strategic about their employment choices in an environment where tips can significantly enhance overall compensation.
More salary data for Jurupa Valley, CA:
Frequently Asked Questions
How much do massage therapists make in Jurupa Valley, CA in 2026?
Is Jurupa Valley, CA a good place to work as a massage therapist?
Can massage therapists make $100K in Jurupa Valley?
What is the cost-of-living adjusted massage therapist salary in Jurupa Valley?
How much does a massage therapist make per hour in Jurupa Valley?
Related Pages
Compare Salaries
Career Resources
Nearby Cities in California
Written by Jordan Lee, LMT
Career Analyst
Jordan Lee has 10 years of experience in massage therapy. They specialize in sports massage. They work in a wellness center.
Methodology & Data Source
Salary figures on this page are 2026 projections based on the Bureau of Labor Statistics Occupational Employment and Wage Statistics (OEWS) survey, May 2026 release. The BLS reported a median annual salary of $50,281 for massage therapistsin the Jurupa Valley metropolitan area. A 6.03% compound annual growth rate (CAGR), calculated from 6-year national BLS wage trends, was applied to project current 2026 compensation. Percentile ranges (P10–P90) represent the full salary distribution across experience levels and practice settings in this market.
Data Sources & Methodology
Salary data for Jurupa Valley is estimated from official BLS state-level occupational wage data (2025), adjusted for regional cost-of-living differences using BEA RPP (Regional Price Parities).
2026 figures are projected from 2025 BLS data using a compound annual growth rate (CAGR) of 6.03%, derived from historical BLS wage trends for massage therapists (SOC 31-9011).
Compiled and verified by Jordan Lee, LMT, a licensed massage therapist with 10+ years of clinical experience. · View source data at BLS.gov