Massage Therapist Salary in Little Rock, AR: $45,625 (2026)
Quick Answer:A full-time massage therapist in Little Rock, AR earns a median $45,625/year (≈ $21.94/hour) in nominal terms for 2026 — projected from BLS OEWS 2025 (SOC 31-9011). Once you factor in Little Rock's price level (11% below national, BEA RPP 89.4), that paycheck buys what $51,055 would nationally. Nominal pay sits 15.3% below the Arkansas state average.
Official BLS data · View source
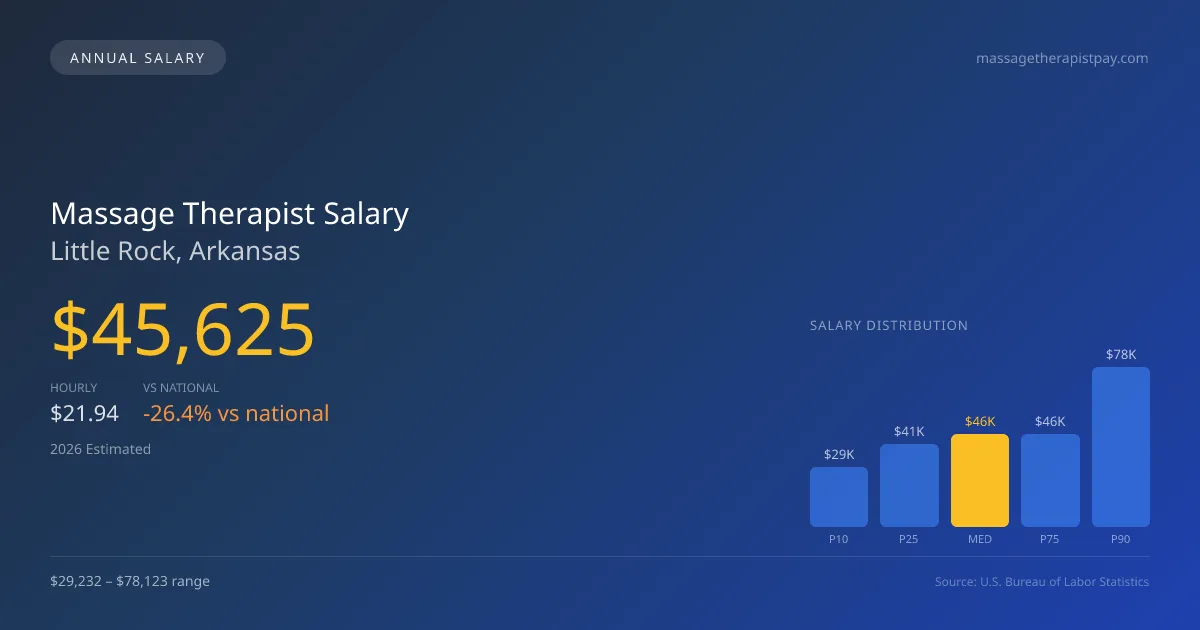
In 2026, the projected median salary for massage therapists in Little Rock, Arkansas, is estimated at $45,625, marking a significant gap compared to the national median of $61,975. Compensation in the region varies widely, with salaries ranging from $29,232 at the 10th percentile to $78,123 at the 90th percentile, according to data based on 2025 BLS OEWS surveys. While franchise chains like Massage Envy and Hand & Stone usually offer lower pay structures, independent and self-employed practitioners can command higher fees, often benefitting from direct client relationships and tips. This pay gradient highlights the differences in earnings potential within the massage therapy field in Little Rock, making it crucial for professionals to weigh their options carefully when choosing their employment model.
Salary Breakdown
| Percentile | Annual | Hourly |
|---|---|---|
| Entry Level (P10) | $29,232 | $14.05 |
| Lower Range (P25) | $40,694 | $19.56 |
| Median (P50)(typical) | $45,625 | $21.94 |
| Upper Range (P75) | $45,635 | $21.94 |
| Top Earners (P90) | $78,123 | $37.56 |
Median Salary Position
26.38% below the national average
2026 Salary Percentile Distribution in Little Rock
In Little Rock, AR, the massage therapist salary spread from the 10th to 90th percentile is $48,891 (2026 est.). At $45,625, the local median is 26.38% below the national median of $61,975.
Salary Calculator
At 40 hours/week in Little Rock: You'd be in the lower-middle range
How Little Rock Massage Therapist Pay Compares
Little Rock median: $45,625/year (2026)
| Compared To | Median Salary | Little Rock Pays |
|---|---|---|
| Arkansas Average | $53,866 | -15.30% less |
| National Average | $61,975 | -26.38% less |
Massage Therapists in Little Rock, AR earn a median of $45,625 per year (2026 est.), which is 26.38% lower than the national median of $61,975 and 15.30% below the Arkansas state average of $53,866.
Cost-of-Living Adjusted Salary
Little Rock has a cost of living 10.64% below the national average, meaning your salary goes further here.
Adjusted salary = nominal × (100 / CoL index). CoL index: 100 = national average.
Little Rock, AR has a cost-of-living index of 89.364 (below the national average of 100). A massage therapist earning $45,625 nominally has purchasing power equivalent to $51,055 in an average-cost city — an effective 11.9% boost.
Compare Purchasing Power
Select a city to see how your salary compares after cost of living
Select a city above to compare purchasing power
2019 BLS Actual
$51,170
2025 BLS Actual
$43,030
2026 Current Est.
$45,625
2019–2027 Growth
+-5.5%
Salary Trajectory for Massage Therapists in Little Rock (2019–2027)
2019–2025: actual BLS OEWS data for this metro area. 2026+: CAGR 6.03% projection.
| Year | Annual Salary | Status |
|---|---|---|
| 2019 | $51,170 | Actual |
| 2020 | $57,360 | Actual |
| 2021 | $38,530 | Actual |
| 2022 | $40,210 | Actual |
| 2023 | $40,000 | Actual |
| 2024 | $30,020 | Actual |
| 2025 | $43,030 | Actual |
| 2026(current) | $45,625 | Estimated |
| 2027 | $48,376 | Projected |
Based on 7 years of BLS OEWS data for the Little Rock metropolitan area, the median massage therapist salary grew -15.9% from $51,170 (2019) to $43,030 (2025). At a 6.03% compound annual growth rate, salaries are projected to reach $48,376 by 2027 — a total increase of $-2,794 (-5.46%) from 2019.
Note: Historical values (2019–2025) are actual BLS OEWS figures for the Little Rock metropolitan area, sourced from annual Occupational Employment and Wage Statistics surveys. 2026–2026 figures are current estimates, and 2027 values are projections, calculated using a 6.03% CAGR derived from 7-year BLS historical data. Actual salaries may vary based on employer, experience, certifications, and local market conditions.
Salary by Experience Level
| Experience | Estimated Salary Range |
|---|---|
| 0-2 years (New Graduate) | $29,232 – $40,694 |
| 3-5 years (Mid Career) | $40,694 – $45,625 |
| 5+ years (Experienced) | $45,625 – $45,635 |
| 10+ years (Top Earner) | $45,635 – $78,123 |
LMT salary ranges estimated from BLS percentile data. Individual massage therapist compensation varies by employer, certifications, and specialization.
Massage Therapist Job Market in Little Rock
The local job market features approximately 210 massage therapists, reflecting a relatively stable demand in the area. With a cost-of-living index at 89.364, the economic landscape of Little Rock suggests a favorable environment for take-home earnings, making massage therapy a viable career for many. Franchise operations generally provide the lowest salary ranges, but they counterbalance that with consistent client flow. In contrast, self-employed therapists can maximize their income potential significantly—charging fees that can reach upwards of $150 per hour plus gratuities. Factors such as specialization in high-demand areas like oncology or sports massage can contribute to increased earning opportunities. Networking, enhancing skills through certifications, and focusing on extensive marketing can further elevate massage therapist pay in Little Rock, AR, making strategic choices essential for financial success in this profession.
More salary data for Little Rock, AR:
Frequently Asked Questions
How much do massage therapists make in Little Rock, AR in 2026?
Is Little Rock, AR a good place to work as a massage therapist?
Can massage therapists make $100K in Little Rock?
What is the cost-of-living adjusted massage therapist salary in Little Rock?
How much does a massage therapist make per hour in Little Rock?
Related Pages
Compare Salaries
Career Resources
Nearby Cities in Arkansas
Written by Jordan Lee, LMT
Career Analyst
Jordan Lee has 10 years of experience in massage therapy. They specialize in sports massage. They work in a wellness center.
Methodology & Data Source
Salary figures on this page are 2026 projections based on the Bureau of Labor Statistics Occupational Employment and Wage Statistics (OEWS) survey, May 2026 release. The BLS reported a median annual salary of $43,030 for massage therapistsin the Little Rock metropolitan area. A 6.03% compound annual growth rate (CAGR), calculated from 6-year national BLS wage trends, was applied to project current 2026 compensation. Percentile ranges (P10–P90) represent the full salary distribution across experience levels and practice settings in this market.
Data Sources & Methodology
Source: BLS, OEWS, 7-year dataset (–). Per-city data from annual BLS metropolitan area surveys.
2026 figures are projected from 2025 BLS data using a compound annual growth rate (CAGR) of 6.03%, derived from historical BLS wage trends for massage therapists (SOC 31-9011).
Compiled and verified by Jordan Lee, LMT, a licensed massage therapist with 10+ years of clinical experience. · View source data at BLS.gov