Massage Therapist Hourly Pay in Brentwood, TN: $23.61 (2026)
Quick Answer:Hourly pay for a massage therapist working in Brentwood, TN runs $23.61 at the median for 2026 — annualizing to $49,124 at a standard 2,080-hour year. Figures projected from BLS OEWS 2025 (SOC 31-9011). Weighted against Brentwood's regional price level (BEA RPP 91.8, 8% below national), each hour of work buys what $25.72 nationally would. A 24-hour part-time schedule grosses $29,469 per year.
Based on BLS state-level estimates · View source
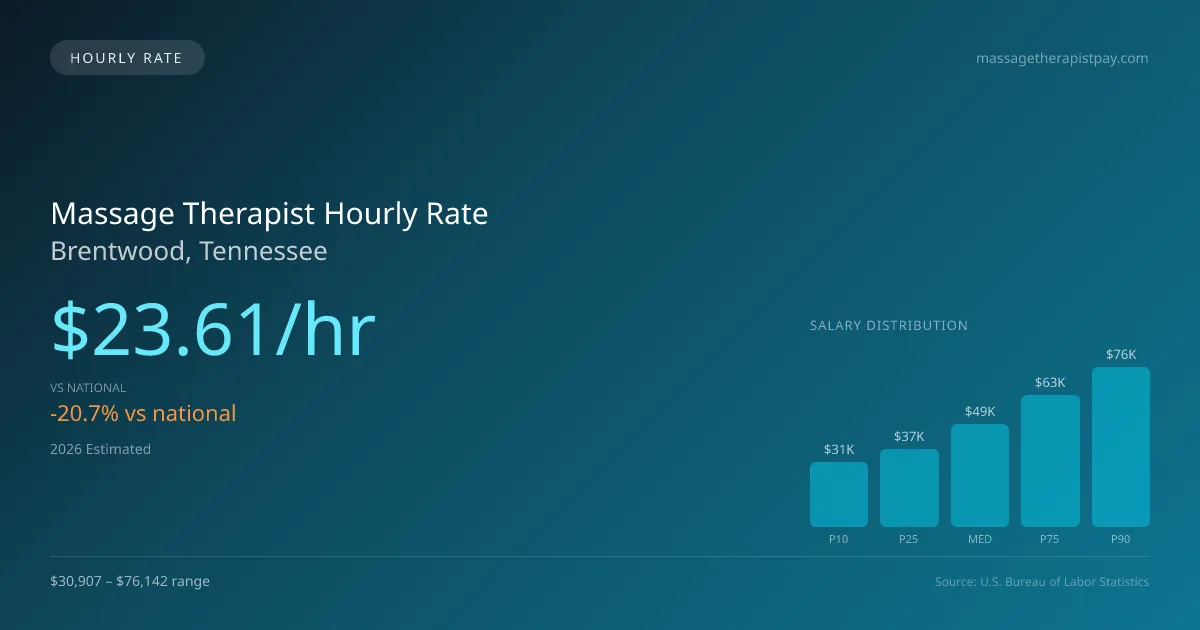
In Brentwood, Tennessee, the projected median hourly pay for a massage therapist in 2026 stands at $23.61. This figure is noticeably lower than the national hourly median of $29.80, signaling a distinct pay variance that reflects the local economic conditions. For those working part-time, like therapists who operate three days a week, this hourly rate translates into approximately $1,013 monthly, offering modest earnings compared to full-time positions. The hourly compensation ranges from $14.85 at the lower end (10th percentile) up to $36.61 for experienced therapists in the top 90th percentile. Given the diverse work environments—spas, chiropractic clinics, sports team facilities, or even mobile services—these rates provide a foundational context for those entering or transitioning within the profession.
About the Brentwood Market
Salary estimated from Tennessee average ($42,000) adjusted for local cost of living.
Massage Therapist Hourly Wage Breakdown
| Percentile | Hourly Rate | Per 8hr Shift |
|---|---|---|
| Entry Level (P10) | $14.85 | $118.84 |
| Lower Range (P25) | $17.76 | $142.08 |
| Median (P50) | $23.61 | $188.90 |
| Upper Range (P75) | $30.23 | $241.83 |
| Top Earners (P90) | $36.61 | $292.90 |
Estimated Annual Income by Work Schedule in Brentwood
Based on $23.61/hr median hourly rate · 2026 est.
At $23.61/hr, a massage therapist working full-time (40 hr/wk) in Brentwood, TN can expect to earn approximately $49,115 per year (2026 est.). Part-time hygienists working 24 hours per week would earn around $28,335. With a cost-of-living index of 91.80 (below the national average), these earnings stretch further in Brentwood.
Hourly Rate Calculator
Schedule Comparison in Brentwood
| Schedule | Weekly | Monthly | Annual |
|---|---|---|---|
| Full-Time (40 hrs) | $944.52 | $4,093 | $49,115 |
| Part-Time (24 hrs) | $566.71 | $2,456 | $29,469 |
| Per Diem (16 hrs) | $377.81 | $1,637 | $19,646 |
Compare LMT Wages With Similar Roles
| Role | Median Hourly |
|---|---|
| Massage Therapist (Brentwood) | $23.61 |
| Physical Therapist Assistant (National Avg) | $31.26 |
| Occupational Therapy Assistant (National Avg) | $32.45 |
| Medical Assistant (National Avg) | $20.14 |
| Exercise Trainer/Fitness Instructor (National Avg) | $23.95 |
Massage Therapists in Brentwood, TN earn a median of $49,124 per year (2026 est.), which is 20.74% lower than the national median of $61,975 and 3.50% below the Tennessee state average of $50,905.
Massage Therapist Hourly Pay vs. Cost of Living
Working 24h/week at $23.61/hr = $29,469/year (purchasing power: $32,101).
Working 40h/week (full-time) = $49,115/year (purchasing power: $53,502).
CoL index: 91.8 (100 = national average). Your dollars stretch further here.
2019 BLS Actual
$16.31/hr
2025 BLS Actual
$22.27/hr
2026 Current Est.
$23.61/hr
2019–2027 Growth
+53.5%
Hourly Rate Trajectory for Massage Therapists in Brentwood (2019–2027)
2019–2025: actual BLS OEWS data for this metro area. 2026+: CAGR 6.03% projection.
| Year | Hourly Rate | Status |
|---|---|---|
| 2019 | $16.31/hr | Actual |
| 2020 | $16.62/hr | Actual |
| 2021 | $17.87/hr | Actual |
| 2022 | $19.00/hr | Actual |
| 2023 | $21.07/hr | Actual |
| 2024 | $17.88/hr | Actual |
| 2025 | $22.27/hr | Actual |
| 2026(current) | $23.61/hr | Estimated |
| 2027 | $25.04/hr | Projected |
Based on 7 years of BLS OEWS metropolitan area data, the median hourly rate for massage therapists in Brentwood grew 36.5% from $16.31/hr (2019) to $22.27/hr (2025). At a 6.03% projected growth rate, hourly pay is expected to reach $25.04/hr by 2027. Part-time and per-diem massage therapists can use this multi-year trend to benchmark future contract negotiations.
Note: Historical values (2019–2025) are actual BLS OEWS figures for the Brentwood metropolitan area, sourced from annual Occupational Employment and Wage Statistics surveys. 2026–2026 figures are current estimates, and 2027 values are projections, calculated using a 6.03% CAGR derived from 7-year BLS historical data. Actual salaries may vary based on employer, experience, certifications, and local market conditions.
Working as an Hourly Massage Therapist in Brentwood
The earning potential for part-time therapists can be slightly limiting compared to their full-time peers. For instance, working just 24 hours per week at the median pay results in an annual income significantly below what a full-time role could achieve. Additionally, the dynamics of per diem massage therapist pay in Brentwood can vary widely; therapists in chain establishments may charge between $25 and $40 for each session, while those in independent practices can bill as much as $60 to $100 per session. Self-employed therapists in Brentwood may experience higher rates, charging $80 to $150 per hour, with mobile practices further inflating session costs to around $120 to $200. This pay disparity often reflects compromises between the security of steady employment and the flexibility—and potential higher earnings—of self-employment. Negotiation tips for hourly workers may include emphasizing client retention rates or unique skill sets, which can justify higher compensation in a competitive market.
More salary data for Brentwood, TN:
Frequently Asked Questions
What is the hourly rate for massage therapists in Brentwood in 2026?
How much do part-time massage therapists make in Brentwood?
Are massage therapists in Brentwood paid hourly or salary?
How much does a full-time massage therapist make per year in Brentwood?
Do massage therapists earn more per hour working part-time in Brentwood?
Related Pages
Compare Salaries
Career Resources
Nearby Cities in Tennessee
Written by Jordan Lee, LMT
Career Analyst
Jordan Lee has 10 years of experience in massage therapy. They specialize in sports massage. They work in a wellness center.
Methodology & Data Source
Hourly wage figures on this page are 2026 projections based on the Bureau of Labor Statistics Occupational Employment and Wage Statistics (OEWS) survey, May 2026 release. A 6.03% compound annual growth rate (CAGR), derived from 6-year national BLS wage trends, was applied to estimate current 2026 hourly rates for massage therapists in Brentwood. Part-time and full-time income estimates assume consistent weekly hours and do not account for overtime, benefits, or seasonal variation.
Data Sources & Methodology
Salary data for Brentwood is estimated from official BLS state-level occupational wage data (2025), adjusted for regional cost-of-living differences using BEA RPP (Regional Price Parities).
2026 figures are projected from 2025 BLS data using a compound annual growth rate (CAGR) of 6.03%, derived from historical BLS wage trends for massage therapists (SOC 31-9011).
Compiled and verified by Jordan Lee, LMT, a licensed massage therapist with 10+ years of clinical experience. · View source data at BLS.gov