Massage Therapist Hourly Pay in Woodbridge, NJ: $34.79 (2026)
Quick Answer:Hourly pay for a massage therapist working in Woodbridge, NJ runs $34.79 at the median for 2026 — annualizing to $72,359 at a standard 2,080-hour year. Figures projected from BLS OEWS 2025 (SOC 31-9011). Weighted against Woodbridge's regional price level (BEA RPP 115.2, 15% above national), each hour of work buys what $30.20 nationally would. A 24-hour part-time schedule grosses $43,416 per year.
Based on BLS state-level estimates · View source
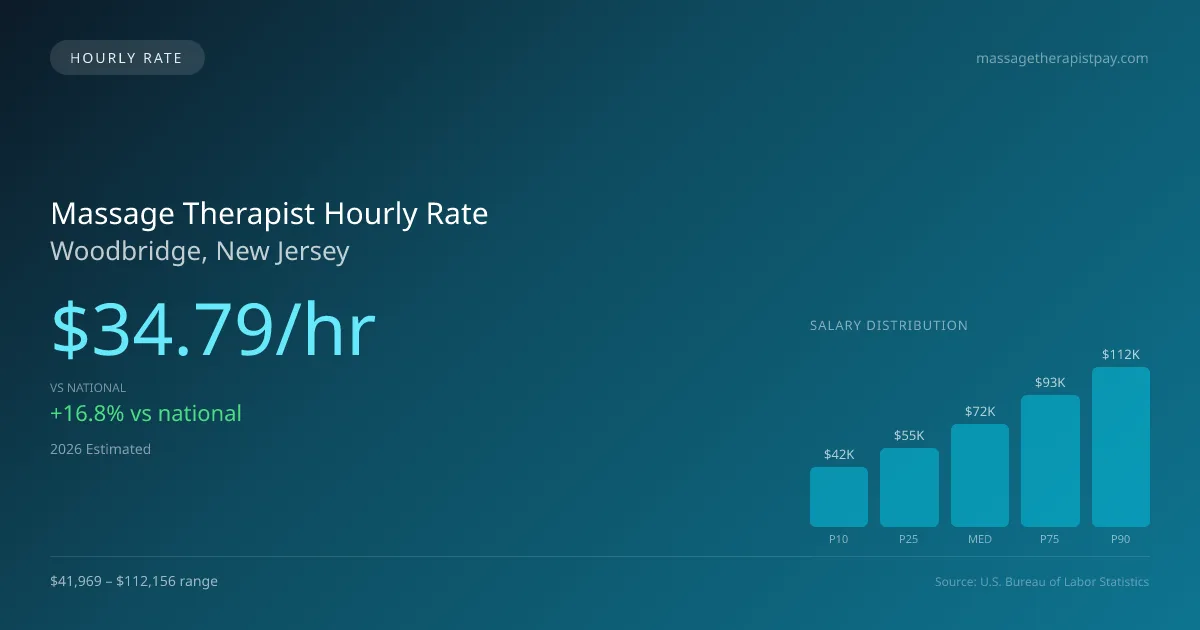
In Woodbridge, New Jersey, massage therapists earn a median hourly rate of $34.79, which is significantly higher than the national median of $29.80. This attractive hourly pay makes the profession appealing not just for full-time staff, but also for part-time or per-diem workers who may only commit to three days a week. For those engaged in typical settings like spa treatment rooms, chiropractic clinics, or mobile practices, this hourly compensation allows for a reasonable income without the need for full-time employment. The hourly earnings for massage therapists in the area range from $20.18 for entry-level positions to around $53.92 for seasoned professionals, indicating a promising trajectory for those willing to advance their skills and leverage their experience.
About the Woodbridge Market
Salary estimated from New Jersey average ($52,000) adjusted for local cost of living.
Massage Therapist Hourly Wage Breakdown
| Percentile | Hourly Rate | Per 8hr Shift |
|---|---|---|
| Entry Level (P10) | $20.18 | $161.42 |
| Lower Range (P25) | $26.63 | $213.08 |
| Median (P50) | $34.79 | $278.31 |
| Upper Range (P75) | $44.53 | $356.26 |
| Top Earners (P90) | $53.92 | $431.33 |
Estimated Annual Income by Work Schedule in Woodbridge
Based on $34.79/hr median hourly rate · 2026 est.
At $34.79/hr, a massage therapist working full-time (40 hr/wk) in Woodbridge, NJ can expect to earn approximately $72,360 per year (2026 est.). Part-time hygienists working 24 hours per week would earn around $41,746. With a cost-of-living index of 115.20 (above the national average), these earnings may be offset by higher expenses in Woodbridge.
Hourly Rate Calculator
Schedule Comparison in Woodbridge
| Schedule | Weekly | Monthly | Annual |
|---|---|---|---|
| Full-Time (40 hrs) | $1,391.54 | $6,030 | $72,360 |
| Part-Time (24 hrs) | $834.92 | $3,618 | $43,416 |
| Per Diem (16 hrs) | $556.62 | $2,412 | $28,944 |
Compare LMT Wages With Similar Roles
| Role | Median Hourly |
|---|---|
| Massage Therapist (Woodbridge) | $34.79 |
| Physical Therapist Assistant (National Avg) | $31.26 |
| Occupational Therapy Assistant (National Avg) | $32.45 |
| Medical Assistant (National Avg) | $20.14 |
| Exercise Trainer/Fitness Instructor (National Avg) | $23.95 |
Massage Therapists in Woodbridge, NJ earn a median of $72,359 per year (2026 est.), which is 16.76% higher than the national median of $61,975 and 1.40% above the New Jersey state average of $71,360.
Massage Therapist Hourly Pay vs. Cost of Living
Working 24h/week at $34.79/hr = $43,416/year (purchasing power: $37,687).
Working 40h/week (full-time) = $72,360/year (purchasing power: $62,812).
CoL index: 115.2 (100 = national average).
2019 BLS Actual
$24.04/hr
2025 BLS Actual
$32.81/hr
2026 Current Est.
$34.79/hr
2019–2027 Growth
+53.5%
Hourly Rate Trajectory for Massage Therapists in Woodbridge (2019–2027)
2019–2025: actual BLS OEWS data for this metro area. 2026+: CAGR 6.03% projection.
| Year | Hourly Rate | Status |
|---|---|---|
| 2019 | $24.04/hr | Actual |
| 2020 | $24.49/hr | Actual |
| 2021 | $26.33/hr | Actual |
| 2022 | $27.99/hr | Actual |
| 2023 | $31.05/hr | Actual |
| 2024 | $29.19/hr | Actual |
| 2025 | $32.81/hr | Actual |
| 2026(current) | $34.79/hr | Estimated |
| 2027 | $36.89/hr | Projected |
Based on 7 years of BLS OEWS metropolitan area data, the median hourly rate for massage therapists in Woodbridge grew 36.5% from $24.04/hr (2019) to $32.81/hr (2025). At a 6.03% projected growth rate, hourly pay is expected to reach $36.89/hr by 2027. Part-time and per-diem massage therapists can use this multi-year trend to benchmark future contract negotiations.
Note: Historical values (2019–2025) are actual BLS OEWS figures for the Woodbridge metropolitan area, sourced from annual Occupational Employment and Wage Statistics surveys. 2026–2026 figures are current estimates, and 2027 values are projections, calculated using a 6.03% CAGR derived from 7-year BLS historical data. Actual salaries may vary based on employer, experience, certifications, and local market conditions.
Working as an Hourly Massage Therapist in Woodbridge
Employment in diverse settings significantly influences a massage therapist's earning potential. For a part-time therapist working 24 hours per week, the annual earnings could reach approximately $43,000, compared to those working full-time positions. Those in per-diem roles, such as fill-in spas, typically earn between $25 and $40 per session in larger chains, while independent operators can charge $60 to $100. Self-employed massage therapists might see rates as high as $80 to $150 per hour for cash-pay sessions. While franchise positions like Massage Envy may provide reliable bookings, self-employed therapists enjoy higher earnings but must handle their marketing and overhead costs. Understanding the variations across different employer types, such as chiropractic clinics or resort spas, is essential for effective negotiation. Therapists seeking positions in Woodbridge should weigh the benefits of health insurance against potentially higher pay without these perks, tailoring their choices to their financial goals.
More salary data for Woodbridge, NJ:
Frequently Asked Questions
What is the hourly rate for massage therapists in Woodbridge in 2026?
How much do part-time massage therapists make in Woodbridge?
Are massage therapists in Woodbridge paid hourly or salary?
How much does a full-time massage therapist make per year in Woodbridge?
Do massage therapists earn more per hour working part-time in Woodbridge?
Related Pages
Compare Salaries
Career Resources
Nearby Cities in New Jersey
Written by Jordan Lee, LMT
Career Analyst
Jordan Lee has 10 years of experience in massage therapy. They specialize in sports massage. They work in a wellness center.
Methodology & Data Source
Hourly wage figures on this page are 2026 projections based on the Bureau of Labor Statistics Occupational Employment and Wage Statistics (OEWS) survey, May 2026 release. A 6.03% compound annual growth rate (CAGR), derived from 6-year national BLS wage trends, was applied to estimate current 2026 hourly rates for massage therapists in Woodbridge. Part-time and full-time income estimates assume consistent weekly hours and do not account for overtime, benefits, or seasonal variation.
Data Sources & Methodology
Salary data for Woodbridge is estimated from official BLS state-level occupational wage data (2025), adjusted for regional cost-of-living differences using BEA RPP (Regional Price Parities).
2026 figures are projected from 2025 BLS data using a compound annual growth rate (CAGR) of 6.03%, derived from historical BLS wage trends for massage therapists (SOC 31-9011).
Compiled and verified by Jordan Lee, LMT, a licensed massage therapist with 10+ years of clinical experience. · View source data at BLS.gov