Massage Therapist Hourly Pay in Brick, NJ: $34.57 (2026)
Quick Answer:Hourly pay for a massage therapist working in Brick, NJ runs $34.57 at the median for 2026 — annualizing to $71,899 at a standard 2,080-hour year. Figures projected from BLS OEWS 2025 (SOC 31-9011). Weighted against Brick's regional price level (BEA RPP 115.2, 15% above national), each hour of work buys what $30.01 nationally would. A 24-hour part-time schedule grosses $43,138 per year.
Based on BLS state-level estimates · View source
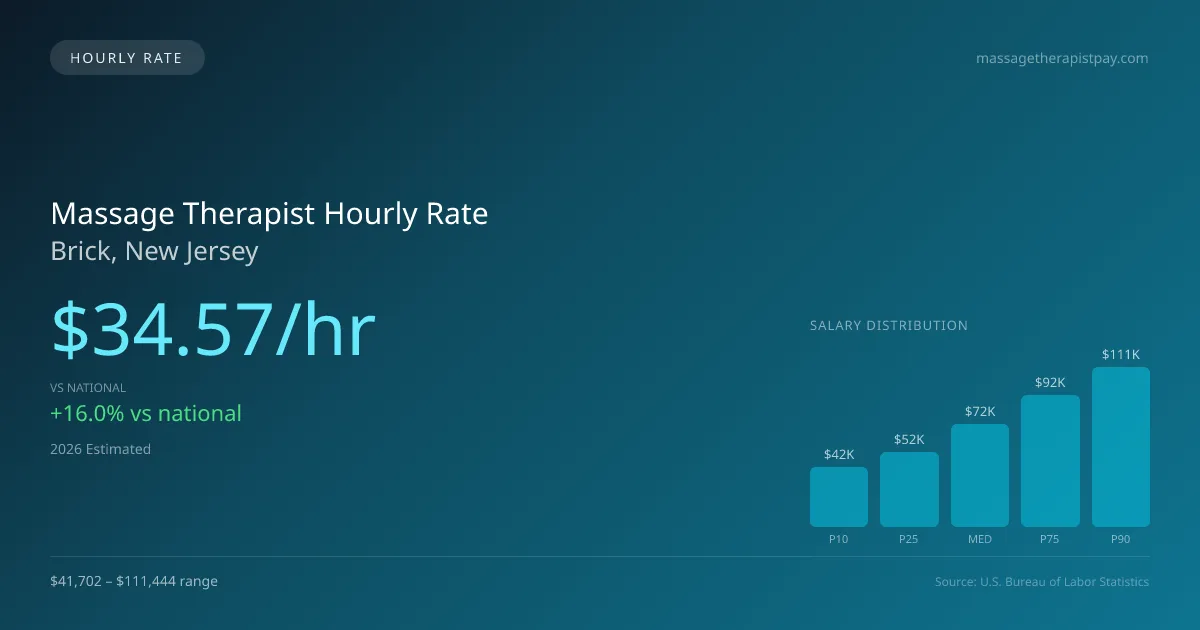
In Brick, New Jersey, massage therapists earn a median hourly pay of $34.57, significantly higher than the national average of $29.80. This favorable rate should appeal to both part-time and per-diem practitioners, especially given the common work environments like spas, chiropractic clinics, and mobile in-home setups, where flexibility is critical. For therapists working part-time, such as three days a week, this hourly wage translates to a sustainable income while allowing for a balanced lifestyle. The hourly pay range in Brick varies widely, with entry-level positions starting at approximately $20.05, and top earners potentially earning up to $53.58 per hour. These figures illustrate the potential for growth and variation in earnings based on experience, specialization, and the nature of the practice, making the profession attractive to diverse therapists in the area.
About the Brick Market
Salary estimated from New Jersey average ($52,000) adjusted for local cost of living.
Massage Therapist Hourly Wage Breakdown
| Percentile | Hourly Rate | Per 8hr Shift |
|---|---|---|
| Entry Level (P10) | $20.05 | $160.40 |
| Lower Range (P25) | $25.22 | $201.80 |
| Median (P50) | $34.57 | $276.53 |
| Upper Range (P75) | $44.25 | $353.97 |
| Top Earners (P90) | $53.58 | $428.62 |
Estimated Annual Income by Work Schedule in Brick
Based on $34.57/hr median hourly rate · 2026 est.
At $34.57/hr, a massage therapist working full-time (40 hr/wk) in Brick, NJ can expect to earn approximately $71,897 per year (2026 est.). Part-time hygienists working 24 hours per week would earn around $41,479. With a cost-of-living index of 115.20 (above the national average), these earnings may be offset by higher expenses in Brick.
Hourly Rate Calculator
Schedule Comparison in Brick
| Schedule | Weekly | Monthly | Annual |
|---|---|---|---|
| Full-Time (40 hrs) | $1,382.63 | $5,991 | $71,897 |
| Part-Time (24 hrs) | $829.58 | $3,595 | $43,138 |
| Per Diem (16 hrs) | $553.05 | $2,397 | $28,759 |
Compare LMT Wages With Similar Roles
| Role | Median Hourly |
|---|---|
| Massage Therapist (Brick) | $34.57 |
| Physical Therapist Assistant (National Avg) | $31.26 |
| Occupational Therapy Assistant (National Avg) | $32.45 |
| Medical Assistant (National Avg) | $20.14 |
| Exercise Trainer/Fitness Instructor (National Avg) | $23.95 |
Massage Therapists in Brick, NJ earn a median of $71,899 per year (2026 est.), which is 16.01% higher than the national median of $61,975 and 0.70% above the New Jersey state average of $71,399.
Massage Therapist Hourly Pay vs. Cost of Living
Working 24h/week at $34.57/hr = $43,138/year (purchasing power: $37,446).
Working 40h/week (full-time) = $71,897/year (purchasing power: $62,410).
CoL index: 115.2 (100 = national average).
2019 BLS Actual
$23.88/hr
2025 BLS Actual
$32.60/hr
2026 Current Est.
$34.57/hr
2019–2027 Growth
+53.5%
Hourly Rate Trajectory for Massage Therapists in Brick (2019–2027)
2019–2025: actual BLS OEWS data for this metro area. 2026+: CAGR 6.03% projection.
| Year | Hourly Rate | Status |
|---|---|---|
| 2019 | $23.88/hr | Actual |
| 2020 | $24.33/hr | Actual |
| 2021 | $26.16/hr | Actual |
| 2022 | $27.81/hr | Actual |
| 2023 | $30.85/hr | Actual |
| 2024 | $29.00/hr | Actual |
| 2025 | $32.60/hr | Actual |
| 2026(current) | $34.57/hr | Estimated |
| 2027 | $36.65/hr | Projected |
Based on 7 years of BLS OEWS metropolitan area data, the median hourly rate for massage therapists in Brick grew 36.5% from $23.88/hr (2019) to $32.60/hr (2025). At a 6.03% projected growth rate, hourly pay is expected to reach $36.65/hr by 2027. Part-time and per-diem massage therapists can use this multi-year trend to benchmark future contract negotiations.
Note: Historical values (2019–2025) are actual BLS OEWS figures for the Brick metropolitan area, sourced from annual Occupational Employment and Wage Statistics surveys. 2026–2026 figures are current estimates, and 2027 values are projections, calculated using a 6.03% CAGR derived from 7-year BLS historical data. Actual salaries may vary based on employer, experience, certifications, and local market conditions.
Working as an Hourly Massage Therapist in Brick
Examining the financial prospects for part-time massage therapists provides insight into their earning potential. A therapist working three days a week, totaling about 24 hours, could expect an annual take-home income that allows for a comfortable living without requiring 40-hour workweeks. Many per-diem massage therapists in Brick operate on a session-based billing system, often earning anywhere from $25 to $40 per session in chain settings, or up to $150 for self-employed cash-pay sessions. Factors such as employer type significantly influence earnings; while franchise spas may offer more stable hours, the pay is generally lower compared to self-employed or independent practices. This distinction offers therapists a choice between steady income that often includes benefits and the potentially higher pay of self-employment without those perks. For those new to the field, it’s wise to negotiate hourly rates based on the specific setting and service offered, leveraging the higher market rates in Brick to ensure a fair compensation aligned with skill level and regional demand.
More salary data for Brick, NJ:
Frequently Asked Questions
What is the hourly rate for massage therapists in Brick in 2026?
How much do part-time massage therapists make in Brick?
Are massage therapists in Brick paid hourly or salary?
How much does a full-time massage therapist make per year in Brick?
Do massage therapists earn more per hour working part-time in Brick?
Related Pages
Compare Salaries
Career Resources
Nearby Cities in New Jersey
Written by Jordan Lee, LMT
Career Analyst
Jordan Lee has 10 years of experience in massage therapy. They specialize in sports massage. They work in a wellness center.
Methodology & Data Source
Hourly wage figures on this page are 2026 projections based on the Bureau of Labor Statistics Occupational Employment and Wage Statistics (OEWS) survey, May 2026 release. A 6.03% compound annual growth rate (CAGR), derived from 6-year national BLS wage trends, was applied to estimate current 2026 hourly rates for massage therapists in Brick. Part-time and full-time income estimates assume consistent weekly hours and do not account for overtime, benefits, or seasonal variation.
Data Sources & Methodology
Salary data for Brick is estimated from official BLS state-level occupational wage data (2025), adjusted for regional cost-of-living differences using BEA RPP (Regional Price Parities).
2026 figures are projected from 2025 BLS data using a compound annual growth rate (CAGR) of 6.03%, derived from historical BLS wage trends for massage therapists (SOC 31-9011).
Compiled and verified by Jordan Lee, LMT, a licensed massage therapist with 10+ years of clinical experience. · View source data at BLS.gov