Massage Therapist Hourly Pay in St. Joseph, MO: $26.77 (2026)
Quick Answer:Hourly pay for a massage therapist working in St. Joseph, MO runs $26.77 at the median for 2026 — annualizing to $55,688 at a standard 2,080-hour year. Figures projected from BLS OEWS 2025 (SOC 31-9011). Weighted against St. Joseph's regional price level (BEA RPP 89.6, 10% below national), each hour of work buys what $29.88 nationally would. A 24-hour part-time schedule grosses $33,412 per year.
Based on BLS state-level estimates · View source
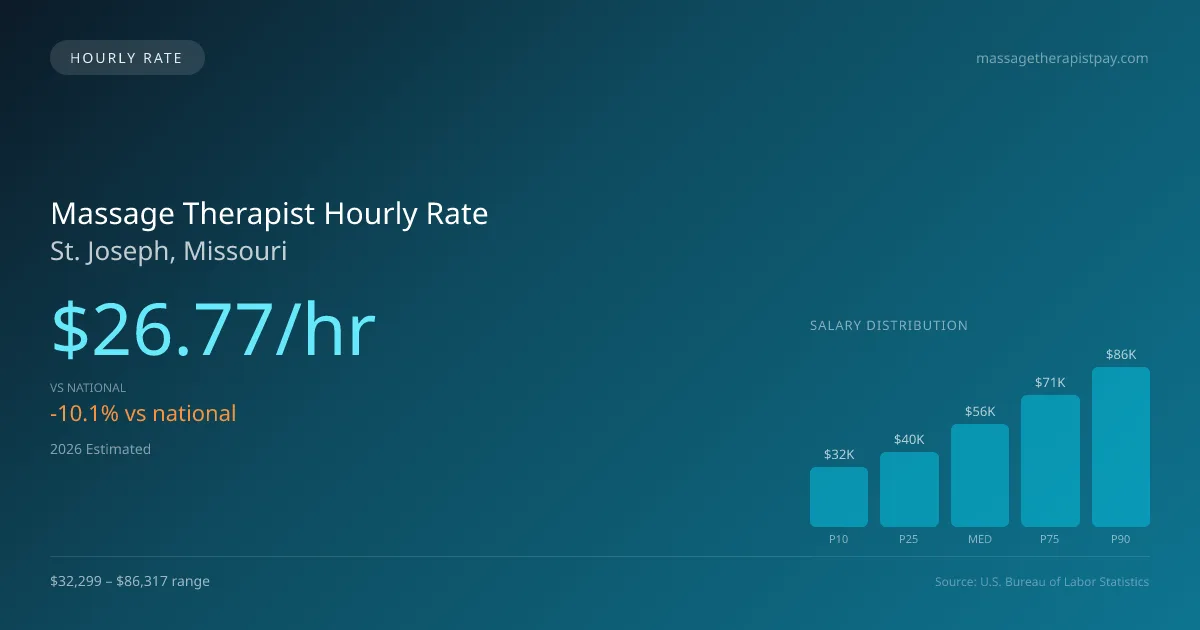
In St. Joseph, Missouri, the projected median hourly pay for massage therapists in 2026 stands at $26.77, which is notably lower than the national median of $29.80. This hourly rate reflects the realities of diverse working arrangements, such as part-time positions often found in settings like spas, chiropractic offices, and mobile practices. For those who work three days a week, typically offering treatments for around 24 hours, this rate translates into approximately $1,680 monthly, offering flexibility for therapists who may also pursue other professional endeavors. The hourly wage range in St. Joseph varies significantly, from $15.53 for entry-level positions to $41.50 for experienced therapists, indicating that earnings can vary widely based on skill level, employer type, and clientele.
About the St. Joseph Market
Salary estimated from Missouri average ($42,000) adjusted for local cost of living.
Massage Therapist Hourly Wage Breakdown
| Percentile | Hourly Rate | Per 8hr Shift |
|---|---|---|
| Entry Level (P10) | $15.53 | $124.27 |
| Lower Range (P25) | $19.40 | $155.23 |
| Median (P50) | $26.77 | $214.18 |
| Upper Range (P75) | $34.27 | $274.15 |
| Top Earners (P90) | $41.50 | $332.00 |
Estimated Annual Income by Work Schedule in St. Joseph
Based on $26.77/hr median hourly rate · 2026 est.
At $26.77/hr, a massage therapist working full-time (40 hr/wk) in St. Joseph, MO can expect to earn approximately $55,687 per year (2026 est.). Part-time hygienists working 24 hours per week would earn around $32,127. With a cost-of-living index of 89.60 (below the national average), these earnings stretch further in St. Joseph.
Hourly Rate Calculator
Schedule Comparison in St. Joseph
| Schedule | Weekly | Monthly | Annual |
|---|---|---|---|
| Full-Time (40 hrs) | $1,070.90 | $4,641 | $55,687 |
| Part-Time (24 hrs) | $642.54 | $2,784 | $33,412 |
| Per Diem (16 hrs) | $428.36 | $1,856 | $22,275 |
Compare LMT Wages With Similar Roles
| Role | Median Hourly |
|---|---|
| Massage Therapist (St. Joseph) | $26.77 |
| Physical Therapist Assistant (National Avg) | $31.26 |
| Occupational Therapy Assistant (National Avg) | $32.45 |
| Medical Assistant (National Avg) | $20.14 |
| Exercise Trainer/Fitness Instructor (National Avg) | $23.95 |
Massage Therapists in St. Joseph, MO earn a median of $55,688 per year (2026 est.), which is 10.14% lower than the national median of $61,975 and 0.30% above the Missouri state average of $55,521.
Massage Therapist Hourly Pay vs. Cost of Living
Working 24h/week at $26.77/hr = $33,412/year (purchasing power: $37,290).
Working 40h/week (full-time) = $55,687/year (purchasing power: $62,151).
CoL index: 89.6 (100 = national average). Your dollars stretch further here.
2019 BLS Actual
$18.50/hr
2025 BLS Actual
$25.25/hr
2026 Current Est.
$26.77/hr
2019–2027 Growth
+53.5%
Hourly Rate Trajectory for Massage Therapists in St. Joseph (2019–2027)
2019–2025: actual BLS OEWS data for this metro area. 2026+: CAGR 6.03% projection.
| Year | Hourly Rate | Status |
|---|---|---|
| 2019 | $18.50/hr | Actual |
| 2020 | $18.84/hr | Actual |
| 2021 | $20.26/hr | Actual |
| 2022 | $21.54/hr | Actual |
| 2023 | $23.89/hr | Actual |
| 2024 | $18.14/hr | Actual |
| 2025 | $25.25/hr | Actual |
| 2026(current) | $26.77/hr | Estimated |
| 2027 | $28.39/hr | Projected |
Based on 7 years of BLS OEWS metropolitan area data, the median hourly rate for massage therapists in St. Joseph grew 36.5% from $18.50/hr (2019) to $25.25/hr (2025). At a 6.03% projected growth rate, hourly pay is expected to reach $28.39/hr by 2027. Part-time and per-diem massage therapists can use this multi-year trend to benchmark future contract negotiations.
Note: Historical values (2019–2025) are actual BLS OEWS figures for the St. Joseph metropolitan area, sourced from annual Occupational Employment and Wage Statistics surveys. 2026–2026 figures are current estimates, and 2027 values are projections, calculated using a 6.03% CAGR derived from 7-year BLS historical data. Actual salaries may vary based on employer, experience, certifications, and local market conditions.
Working as an Hourly Massage Therapist in St. Joseph
When considering part-time work versus full-time employment, a massage therapist working 24 hours per week in St. Joseph would earn approximately $20,160 annually, significantly less than their full-time counterparts. For per-diem or agency therapists, compensation can vary based on the setting; therapists billing at chain spas might earn $25-$40 per session, while mid-tier independent therapists can charge $60-$100 for similar sessions. Self-employed practitioners may see higher earnings, typically charging between $80 and $150 for a session, particularly in the mobile, in-home market, where session rates can go as high as $120-$200. Employment type significantly impacts hourly rates; those in franchise chains like Massage Envy may see lower compensation but enjoy more consistent client bookings, while independent operators bear the risk of higher overhead but retain greater profit margins. Therapists might also have to weigh the trade-off between accepting lower hourly rates with health benefits versus higher pay without those perks. For those negotiating their pay in St. Joseph, understanding local market rates and leveraging skills acquired through ABMP and AMTA certifications can be beneficial.
More salary data for St. Joseph, MO:
Frequently Asked Questions
What is the hourly rate for massage therapists in St. Joseph in 2026?
How much do part-time massage therapists make in St. Joseph?
Are massage therapists in St. Joseph paid hourly or salary?
How much does a full-time massage therapist make per year in St. Joseph?
Do massage therapists earn more per hour working part-time in St. Joseph?
Related Pages
Compare Salaries
Career Resources
Nearby Cities in Missouri
Written by Jordan Lee, LMT
Career Analyst
Jordan Lee has 10 years of experience in massage therapy. They specialize in sports massage. They work in a wellness center.
Methodology & Data Source
Hourly wage figures on this page are 2026 projections based on the Bureau of Labor Statistics Occupational Employment and Wage Statistics (OEWS) survey, May 2026 release. A 6.03% compound annual growth rate (CAGR), derived from 6-year national BLS wage trends, was applied to estimate current 2026 hourly rates for massage therapists in St. Joseph. Part-time and full-time income estimates assume consistent weekly hours and do not account for overtime, benefits, or seasonal variation.
Data Sources & Methodology
Salary data for St. Joseph is estimated from official BLS state-level occupational wage data (2025), adjusted for regional cost-of-living differences using BEA RPP (Regional Price Parities).
2026 figures are projected from 2025 BLS data using a compound annual growth rate (CAGR) of 6.03%, derived from historical BLS wage trends for massage therapists (SOC 31-9011).
Compiled and verified by Jordan Lee, LMT, a licensed massage therapist with 10+ years of clinical experience. · View source data at BLS.gov