Massage Therapist Hourly Pay in Barnstable, MA: $28.99 (2026)
Quick Answer:Hourly pay for a massage therapist working in Barnstable, MA runs $28.99 at the median for 2026 — annualizing to $60,294 at a standard 2,080-hour year. Figures projected from BLS OEWS 2025 (SOC 31-9011). Weighted against Barnstable's regional price level (BEA RPP 108.5, 9% above national), each hour of work buys what $26.72 nationally would. A 24-hour part-time schedule grosses $36,178 per year.
Based on BLS state-level estimates · View source
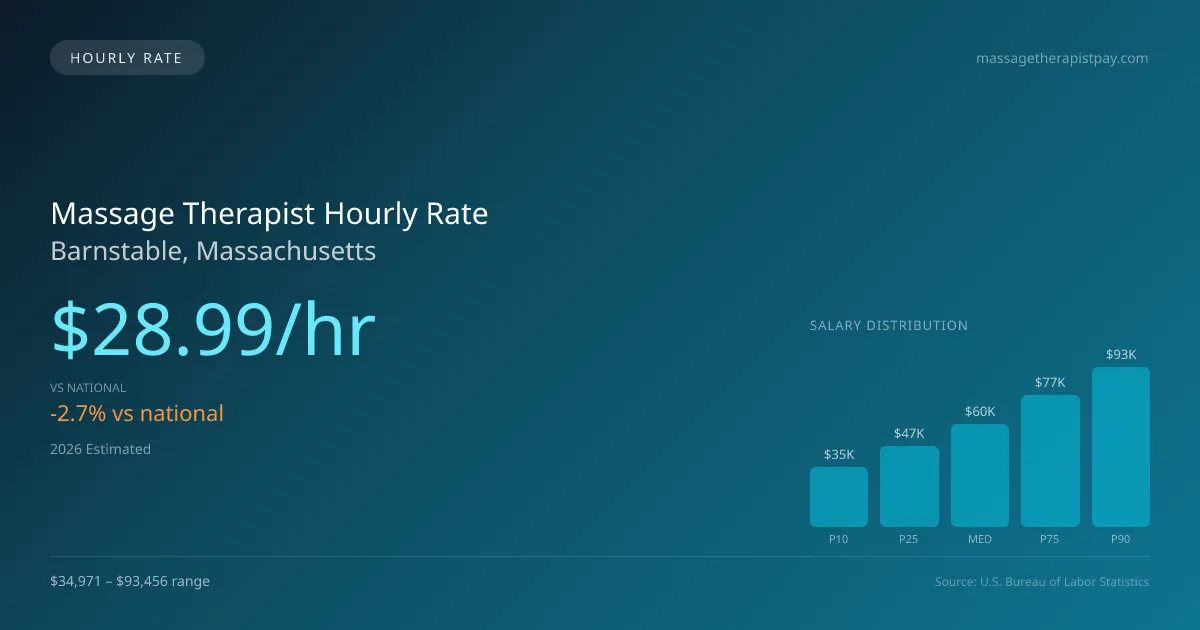
In Barnstable, Massachusetts, massage therapists earn a median hourly rate of $28.99, slightly below the national hourly median of $29.80. This rate allows for varied work arrangements, making it appealing for part-time and per-diem therapists. For instance, those working about three days a week might find themselves in settings such as spa treatment rooms, chiropractic offices, or hotel spas, where their earnings can fluctuate based on client volume and session types. The hourly pay ranges significantly, beginning at $16.82 for entry-level positions and reaching up to $44.94 for the most experienced professionals in the field. These estimates are derived from annual salary data, translated into hourly figures, reflecting the earning potential in this vibrant market.
About the Barnstable Market
Salary estimated from Massachusetts average ($60,000) adjusted for local cost of living.
Massage Therapist Hourly Wage Breakdown
| Percentile | Hourly Rate | Per 8hr Shift |
|---|---|---|
| Entry Level (P10) | $16.82 | $134.53 |
| Lower Range (P25) | $22.71 | $181.69 |
| Median (P50) | $28.99 | $231.91 |
| Upper Range (P75) | $37.10 | $296.80 |
| Top Earners (P90) | $44.94 | $359.48 |
Estimated Annual Income by Work Schedule in Barnstable
Based on $28.99/hr median hourly rate · 2026 est.
At $28.99/hr, a massage therapist working full-time (40 hr/wk) in Barnstable, MA can expect to earn approximately $60,296 per year (2026 est.). Part-time hygienists working 24 hours per week would earn around $34,786. With a cost-of-living index of 108.50 (above the national average), these earnings may be offset by higher expenses in Barnstable.
Hourly Rate Calculator
Schedule Comparison in Barnstable
| Schedule | Weekly | Monthly | Annual |
|---|---|---|---|
| Full-Time (40 hrs) | $1,159.54 | $5,025 | $60,296 |
| Part-Time (24 hrs) | $695.73 | $3,015 | $36,178 |
| Per Diem (16 hrs) | $463.82 | $2,010 | $24,119 |
Compare LMT Wages With Similar Roles
| Role | Median Hourly |
|---|---|
| Massage Therapist (Barnstable) | $28.99 |
| Physical Therapist Assistant (National Avg) | $31.26 |
| Occupational Therapy Assistant (National Avg) | $32.45 |
| Medical Assistant (National Avg) | $20.14 |
| Exercise Trainer/Fitness Instructor (National Avg) | $23.95 |
Massage Therapists in Barnstable, MA earn a median of $60,294 per year (2026 est.), which is 2.71% lower than the national median of $61,975 and 2.80% below the Massachusetts state average of $62,031.
Massage Therapist Hourly Pay vs. Cost of Living
Working 24h/week at $28.99/hr = $36,178/year (purchasing power: $33,344).
Working 40h/week (full-time) = $60,296/year (purchasing power: $55,573).
CoL index: 108.5 (100 = national average).
2019 BLS Actual
$20.03/hr
2025 BLS Actual
$27.34/hr
2026 Current Est.
$28.99/hr
2019–2027 Growth
+53.5%
Hourly Rate Trajectory for Massage Therapists in Barnstable (2019–2027)
2019–2025: actual BLS OEWS data for this metro area. 2026+: CAGR 6.03% projection.
| Year | Hourly Rate | Status |
|---|---|---|
| 2019 | $20.03/hr | Actual |
| 2020 | $20.40/hr | Actual |
| 2021 | $21.94/hr | Actual |
| 2022 | $23.32/hr | Actual |
| 2023 | $25.87/hr | Actual |
| 2024 | $30.42/hr | Actual |
| 2025 | $27.34/hr | Actual |
| 2026(current) | $28.99/hr | Estimated |
| 2027 | $30.74/hr | Projected |
Based on 7 years of BLS OEWS metropolitan area data, the median hourly rate for massage therapists in Barnstable grew 36.5% from $20.03/hr (2019) to $27.34/hr (2025). At a 6.03% projected growth rate, hourly pay is expected to reach $30.74/hr by 2027. Part-time and per-diem massage therapists can use this multi-year trend to benchmark future contract negotiations.
Note: Historical values (2019–2025) are actual BLS OEWS figures for the Barnstable metropolitan area, sourced from annual Occupational Employment and Wage Statistics surveys. 2026–2026 figures are current estimates, and 2027 values are projections, calculated using a 6.03% CAGR derived from 7-year BLS historical data. Actual salaries may vary based on employer, experience, certifications, and local market conditions.
Working as an Hourly Massage Therapist in Barnstable
Considering part-time schedules, a massage therapist who works 24 hours per week can expect to bring home approximately $36,000 annually, significantly less than those in full-time roles. Per diem massage therapists may charge varying rates, with chains offering about $25 to $40 per session while independent therapists might bill up to $150 or more for a 60-minute appointment. Barnstable's landscape offers diverse employment opportunities—spas and clinics typically provide lower hourly rates but often include benefits like health insurance, while self-employed therapists enjoy higher pay per session but cover all business expenses. For those navigating work negotiations, local therapists should consider their value and the benefits related to different employment types, particularly when discussing contracts with franchises versus pursuing a solo practice, which may come with higher risk but also greater financial reward.
More salary data for Barnstable, MA:
Frequently Asked Questions
What is the hourly rate for massage therapists in Barnstable in 2026?
How much do part-time massage therapists make in Barnstable?
Are massage therapists in Barnstable paid hourly or salary?
How much does a full-time massage therapist make per year in Barnstable?
Do massage therapists earn more per hour working part-time in Barnstable?
Related Pages
Compare Salaries
Career Resources
Nearby Cities in Massachusetts
Written by Jordan Lee, LMT
Career Analyst
Jordan Lee has 10 years of experience in massage therapy. They specialize in sports massage. They work in a wellness center.
Methodology & Data Source
Hourly wage figures on this page are 2026 projections based on the Bureau of Labor Statistics Occupational Employment and Wage Statistics (OEWS) survey, May 2026 release. A 6.03% compound annual growth rate (CAGR), derived from 6-year national BLS wage trends, was applied to estimate current 2026 hourly rates for massage therapists in Barnstable. Part-time and full-time income estimates assume consistent weekly hours and do not account for overtime, benefits, or seasonal variation.
Data Sources & Methodology
Salary data for Barnstable is estimated from official BLS state-level occupational wage data (2025), adjusted for regional cost-of-living differences using BEA RPP (Regional Price Parities).
2026 figures are projected from 2025 BLS data using a compound annual growth rate (CAGR) of 6.03%, derived from historical BLS wage trends for massage therapists (SOC 31-9011).
Compiled and verified by Jordan Lee, LMT, a licensed massage therapist with 10+ years of clinical experience. · View source data at BLS.gov