Massage Therapist Hourly Pay in Bridgeport, CT: $37.49 (2026)
Quick Answer:Hourly pay for a massage therapist working in Bridgeport, CT runs $37.49 at the median for 2026 — annualizing to $77,974 at a standard 2,080-hour year. Figures projected from BLS OEWS 2025 (SOC 31-9011). Weighted against Bridgeport's regional price level (BEA RPP 106.9, 7% above national), each hour of work buys what $35.08 nationally would. A 24-hour part-time schedule grosses $46,790 per year.
Official BLS data · View source
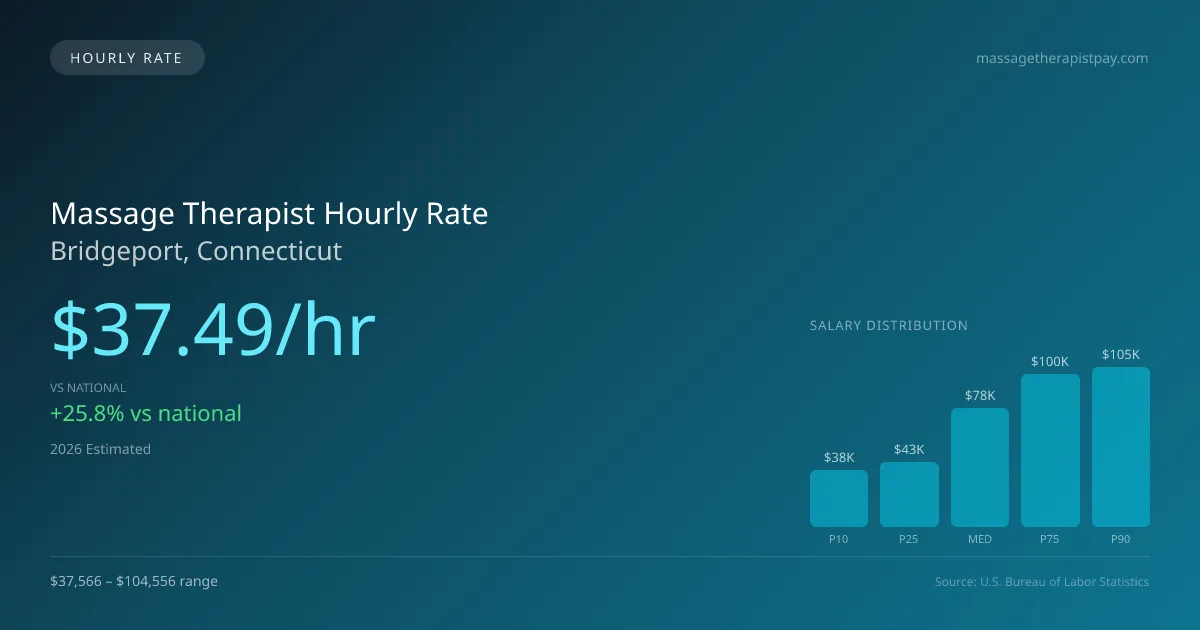
In Bridgeport, Connecticut, the massage therapist hourly pay stands at a median of $37.49, significantly surpassing the national hourly median of $29.80. This higher rate reflects the region's cost of living and demand for skilled practitioners of various massage therapies. For part-time workers, such as those employed three days a week, this hourly rate allows for a respectable income, making it feasible to work in settings like spas, chiropractic clinics, or mobile services. The hourly range spans from about $18.06 at entry-level positions to around $50.27 for experienced professionals, highlighting both opportunities for advancement and the varied market dynamics at play. This data, derived from the official Bureau of Labor Statistics (BLS) based on 2025 data projected to 2026, paints a clear picture of what massage therapists can expect financially in Bridgeport.
Massage Therapist Hourly Wage Breakdown
| Percentile | Hourly Rate | Per 8hr Shift |
|---|---|---|
| Entry Level (P10) | $18.06 | $144.46 |
| Lower Range (P25) | $20.45 | $163.63 |
| Median (P50) | $37.49 | $299.94 |
| Upper Range (P75) | $48.07 | $384.59 |
| Top Earners (P90) | $50.27 | $402.15 |
Estimated Annual Income by Work Schedule in Bridgeport
Based on $37.49/hr median hourly rate · 2026 est.
At $37.49/hr, a massage therapist working full-time (40 hr/wk) in Bridgeport, CT can expect to earn approximately $77,984 per year (2026 est.). Part-time hygienists working 24 hours per week would earn around $44,991. With a cost-of-living index of 106.86 (above the national average), these earnings may be offset by higher expenses in Bridgeport.
Hourly Rate Calculator
Schedule Comparison in Bridgeport
| Schedule | Weekly | Monthly | Annual |
|---|---|---|---|
| Full-Time (40 hrs) | $1,499.69 | $6,499 | $77,984 |
| Part-Time (24 hrs) | $899.81 | $3,899 | $46,790 |
| Per Diem (16 hrs) | $599.88 | $2,599 | $31,194 |
Compare LMT Wages With Similar Roles
| Role | Median Hourly |
|---|---|
| Massage Therapist (Bridgeport) | $37.49 |
| Physical Therapist Assistant (National Avg) | $31.26 |
| Occupational Therapy Assistant (National Avg) | $32.45 |
| Medical Assistant (National Avg) | $20.14 |
| Exercise Trainer/Fitness Instructor (National Avg) | $23.95 |
Massage Therapists in Bridgeport, CT earn a median of $77,974 per year (2026 est.), which is 25.82% higher than the national median of $61,975 and 16.60% above the Connecticut state average of $66,873.
Massage Therapist Hourly Pay vs. Cost of Living
Working 24h/week at $37.49/hr = $46,790/year (purchasing power: $43,785).
Working 40h/week (full-time) = $77,984/year (purchasing power: $72,975).
CoL index: 106.864 (100 = national average).
2019 BLS Actual
$20.24/hr
2025 BLS Actual
$35.36/hr
2026 Current Est.
$37.49/hr
2019–2027 Growth
+96.4%
Hourly Rate Trajectory for Massage Therapists in Bridgeport (2019–2027)
2019–2025: actual BLS OEWS data for this metro area. 2026+: CAGR 6.03% projection.
| Year | Hourly Rate | Status |
|---|---|---|
| 2019 | $20.24/hr | Actual |
| 2020 | $23.61/hr | Actual |
| 2021 | $36.65/hr | Actual |
| 2022 | $36.40/hr | Actual |
| 2023 | $29.47/hr | Actual |
| 2024 | $30.37/hr | Actual |
| 2025 | $35.36/hr | Actual |
| 2026(current) | $37.49/hr | Estimated |
| 2027 | $39.75/hr | Projected |
Based on 7 years of BLS OEWS metropolitan area data, the median hourly rate for massage therapists in Bridgeport grew 74.7% from $20.24/hr (2019) to $35.36/hr (2025). At a 6.03% projected growth rate, hourly pay is expected to reach $39.75/hr by 2027. Part-time and per-diem massage therapists can use this multi-year trend to benchmark future contract negotiations.
Note: Historical values (2019–2025) are actual BLS OEWS figures for the Bridgeport metropolitan area, sourced from annual Occupational Employment and Wage Statistics surveys. 2026–2026 figures are current estimates, and 2027 values are projections, calculated using a 6.03% CAGR derived from 7-year BLS historical data. Actual salaries may vary based on employer, experience, certifications, and local market conditions.
Working as an Hourly Massage Therapist in Bridgeport
Focusing on part-time earnings, a massage therapist working 24 hours a week can expect to bring home approximately $46,584 annually before taxes, contrasting sharply with full-time earnings. For those opting for per-diem or agency work, pay rates can differ significantly depending on the employer; for instance, spa therapists in chain environments may earn $25-$40 per session, while independent therapists can charge $80-$150 for a 60-minute session. Additionally, mobile therapists often command a premium, with rates ranging from $120 to $200 per visit. Hourly rates across different employer types will vary: franchise chains often provide lower wages in exchange for job security, while self-employed therapists have the potential to earn more but face additional overhead costs. As such, some therapists may accept positions with lower hourly wages in exchange for benefits like health insurance, highlighting the trade-offs in the industry. When negotiating pay, it’s essential to research typical compensation rates in Bridgeport and articulate the value of your skills and experience.
More salary data for Bridgeport, CT:
Frequently Asked Questions
What is the hourly rate for massage therapists in Bridgeport in 2026?
How much do part-time massage therapists make in Bridgeport?
Are massage therapists in Bridgeport paid hourly or salary?
How much does a full-time massage therapist make per year in Bridgeport?
Do massage therapists earn more per hour working part-time in Bridgeport?
Related Pages
Compare Salaries
Career Resources
Nearby Cities in Connecticut
Written by Jordan Lee, LMT
Career Analyst
Jordan Lee has 10 years of experience in massage therapy. They specialize in sports massage. They work in a wellness center.
Methodology & Data Source
Hourly wage figures on this page are 2026 projections based on the Bureau of Labor Statistics Occupational Employment and Wage Statistics (OEWS) survey, May 2026 release. A 6.03% compound annual growth rate (CAGR), derived from 6-year national BLS wage trends, was applied to estimate current 2026 hourly rates for massage therapists in Bridgeport. Part-time and full-time income estimates assume consistent weekly hours and do not account for overtime, benefits, or seasonal variation.
Data Sources & Methodology
Source: BLS, OEWS, 7-year dataset (–). Per-city data from annual BLS metropolitan area surveys.
2026 figures are projected from 2025 BLS data using a compound annual growth rate (CAGR) of 6.03%, derived from historical BLS wage trends for massage therapists (SOC 31-9011).
Compiled and verified by Jordan Lee, LMT, a licensed massage therapist with 10+ years of clinical experience. · View source data at BLS.gov