Massage Therapist Hourly Pay in Milpitas, CA: $24.81 (2026)
Quick Answer:Hourly pay for a massage therapist working in Milpitas, CA runs $24.81 at the median for 2026 — annualizing to $51,604 at a standard 2,080-hour year. Figures projected from BLS OEWS 2025 (SOC 31-9011). Weighted against Milpitas's regional price level (BEA RPP 113.1, 13% above national), each hour of work buys what $21.94 nationally would. A 24-hour part-time schedule grosses $30,964 per year.
Based on BLS state-level estimates · View source
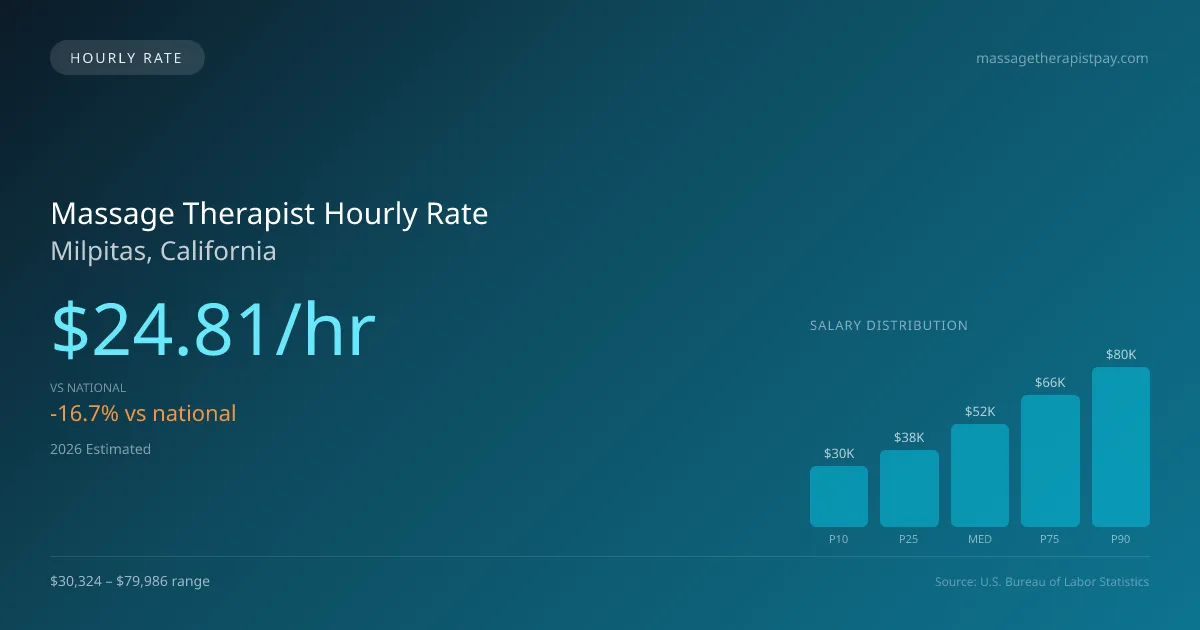
In Milpitas, California, the average hourly pay for a massage therapist is projected to be $24.81 in 2026, significantly lower than the national hourly median of $29.80. This disparity presents both challenges and opportunities for part-time and per-diem workers, who may find flexibility in various settings such as spas, hospitals, and mobile practices. For those working part-time at approximately three days a week, the income can vary significantly based on session fees and the number of clients. The hourly range in the area spans from $14.58 for entry-level positions to $38.46 for those at the top end of the pay scale. These rates provide insight into the earning potential across different environments, from luxury hotel spas to self-employed practices, reflecting how local conditions affect hourly wages.
About the Milpitas Market
Salary estimated from California average ($58,000) adjusted for local cost of living.
Massage Therapist Hourly Wage Breakdown
| Percentile | Hourly Rate | Per 8hr Shift |
|---|---|---|
| Entry Level (P10) | $14.58 | $116.63 |
| Lower Range (P25) | $18.49 | $147.93 |
| Median (P50) | $24.81 | $198.49 |
| Upper Range (P75) | $31.76 | $254.05 |
| Top Earners (P90) | $38.46 | $307.66 |
Estimated Annual Income by Work Schedule in Milpitas
Based on $24.81/hr median hourly rate · 2026 est.
At $24.81/hr, a massage therapist working full-time (40 hr/wk) in Milpitas, CA can expect to earn approximately $51,607 per year (2026 est.). Part-time hygienists working 24 hours per week would earn around $29,773. With a cost-of-living index of 113.10 (above the national average), these earnings may be offset by higher expenses in Milpitas.
Hourly Rate Calculator
Schedule Comparison in Milpitas
| Schedule | Weekly | Monthly | Annual |
|---|---|---|---|
| Full-Time (40 hrs) | $992.44 | $4,301 | $51,607 |
| Part-Time (24 hrs) | $595.46 | $2,580 | $30,964 |
| Per Diem (16 hrs) | $396.98 | $1,720 | $20,643 |
Compare LMT Wages With Similar Roles
| Role | Median Hourly |
|---|---|
| Massage Therapist (Milpitas) | $24.81 |
| Physical Therapist Assistant (National Avg) | $31.26 |
| Occupational Therapy Assistant (National Avg) | $32.45 |
| Medical Assistant (National Avg) | $20.14 |
| Exercise Trainer/Fitness Instructor (National Avg) | $23.95 |
Massage Therapists in Milpitas, CA earn a median of $51,604 per year (2026 est.), which is 16.73% lower than the national median of $61,975 and 3.00% below the California state average of $53,200.
Massage Therapist Hourly Pay vs. Cost of Living
Working 24h/week at $24.81/hr = $30,964/year (purchasing power: $27,378).
Working 40h/week (full-time) = $51,607/year (purchasing power: $45,629).
CoL index: 113.1 (100 = national average).
2019 BLS Actual
$17.14/hr
2025 BLS Actual
$23.40/hr
2026 Current Est.
$24.81/hr
2019–2027 Growth
+53.5%
Hourly Rate Trajectory for Massage Therapists in Milpitas (2019–2027)
2019–2025: actual BLS OEWS data for this metro area. 2026+: CAGR 6.03% projection.
| Year | Hourly Rate | Status |
|---|---|---|
| 2019 | $17.14/hr | Actual |
| 2020 | $17.46/hr | Actual |
| 2021 | $18.78/hr | Actual |
| 2022 | $19.96/hr | Actual |
| 2023 | $22.14/hr | Actual |
| 2024 | $30.61/hr | Actual |
| 2025 | $23.40/hr | Actual |
| 2026(current) | $24.81/hr | Estimated |
| 2027 | $26.31/hr | Projected |
Based on 7 years of BLS OEWS metropolitan area data, the median hourly rate for massage therapists in Milpitas grew 36.5% from $17.14/hr (2019) to $23.40/hr (2025). At a 6.03% projected growth rate, hourly pay is expected to reach $26.31/hr by 2027. Part-time and per-diem massage therapists can use this multi-year trend to benchmark future contract negotiations.
Note: Historical values (2019–2025) are actual BLS OEWS figures for the Milpitas metropolitan area, sourced from annual Occupational Employment and Wage Statistics surveys. 2026–2026 figures are current estimates, and 2027 values are projections, calculated using a 6.03% CAGR derived from 7-year BLS historical data. Actual salaries may vary based on employer, experience, certifications, and local market conditions.
Working as an Hourly Massage Therapist in Milpitas
Transitioning to a more analytical perspective, part-time therapists in Milpitas might earn a modest annual income if they work a 24-hour schedule each week, resulting in total compensation reflective of their limited hours. In the case of per-diem work, hourly session rates can drastically vary; therapists at chain spas may bill between $25 and $40 per session, while those in independent settings could charge $80 to $150 for a 60-minute appointment. This discrepancy reveals a similar trend with mobile services, where fees can reach $120 to $200 per session, attracting clients who value convenience. Employer type significantly influences hourly rates, as facilities like chiropractic offices or physical therapy clinics may offer more stable compensation alongside benefits compared to franchise chains, which typically offer lower pay but a more predictable schedule. As therapists evaluate their options, negotiating for higher pay in exchange for accepting fewer benefits can be critical in maximizing their earning potential in Milpitas.
More salary data for Milpitas, CA:
Frequently Asked Questions
What is the hourly rate for massage therapists in Milpitas in 2026?
How much do part-time massage therapists make in Milpitas?
Are massage therapists in Milpitas paid hourly or salary?
How much does a full-time massage therapist make per year in Milpitas?
Do massage therapists earn more per hour working part-time in Milpitas?
Related Pages
Compare Salaries
Career Resources
Nearby Cities in California
Written by Jordan Lee, LMT
Career Analyst
Jordan Lee has 10 years of experience in massage therapy. They specialize in sports massage. They work in a wellness center.
Methodology & Data Source
Hourly wage figures on this page are 2026 projections based on the Bureau of Labor Statistics Occupational Employment and Wage Statistics (OEWS) survey, May 2026 release. A 6.03% compound annual growth rate (CAGR), derived from 6-year national BLS wage trends, was applied to estimate current 2026 hourly rates for massage therapists in Milpitas. Part-time and full-time income estimates assume consistent weekly hours and do not account for overtime, benefits, or seasonal variation.
Data Sources & Methodology
Salary data for Milpitas is estimated from official BLS state-level occupational wage data (2025), adjusted for regional cost-of-living differences using BEA RPP (Regional Price Parities).
2026 figures are projected from 2025 BLS data using a compound annual growth rate (CAGR) of 6.03%, derived from historical BLS wage trends for massage therapists (SOC 31-9011).
Compiled and verified by Jordan Lee, LMT, a licensed massage therapist with 10+ years of clinical experience. · View source data at BLS.gov