Massage Therapist Hourly Pay in Fremont, CA: $20.54 (2026)
Quick Answer:Hourly pay for a massage therapist working in Fremont, CA runs $20.54 at the median for 2026 — annualizing to $42,717 at a standard 2,080-hour year. Figures projected from BLS OEWS 2025 (SOC 31-9011). Weighted against Fremont's regional price level (BEA RPP 113.1, 13% above national), each hour of work buys what $18.16 nationally would. A 24-hour part-time schedule grosses $25,631 per year.
Based on BLS state-level estimates · View source
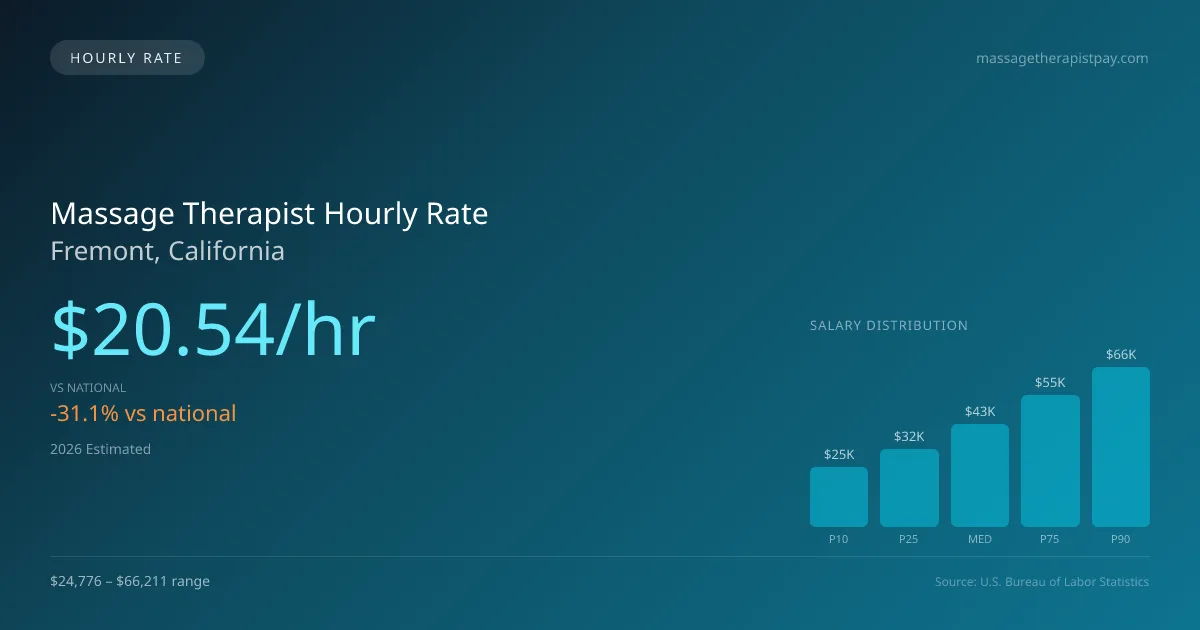
In 2026, massage therapists in Fremont, California, can expect an hourly median rate of $20.54, which is considerably lower than the national average of $29.80 per hour. This rate reflects a range from $11.91 at the entry-level (10th percentile) to $31.83 for the top earners (90th percentile), illustrating the various earning potentials within the profession. For part-time practitioners working three days a week, this translates into a moderate annual income based on a typical 24-hour workweek, which can impact lifestyle choices and financial planning. Settings for these practitioners often include spas, chiropractic clinics, sports training centers, and mobile practices, each offering distinct compensation structures that contribute to overall earnings.
About the Fremont Market
Salary estimated from California average ($58,000) adjusted for local cost of living.
Massage Therapist Hourly Wage Breakdown
| Percentile | Hourly Rate | Per 8hr Shift |
|---|---|---|
| Entry Level (P10) | $11.91 | $95.26 |
| Lower Range (P25) | $15.42 | $123.33 |
| Median (P50) | $20.54 | $164.30 |
| Upper Range (P75) | $26.28 | $210.28 |
| Top Earners (P90) | $31.83 | $254.64 |
Estimated Annual Income by Work Schedule in Fremont
Based on $20.54/hr median hourly rate · 2026 est.
At $20.54/hr, a massage therapist working full-time (40 hr/wk) in Fremont, CA can expect to earn approximately $42,719 per year (2026 est.). Part-time hygienists working 24 hours per week would earn around $24,646. With a cost-of-living index of 113.10 (above the national average), these earnings may be offset by higher expenses in Fremont.
Hourly Rate Calculator
Schedule Comparison in Fremont
| Schedule | Weekly | Monthly | Annual |
|---|---|---|---|
| Full-Time (40 hrs) | $821.52 | $3,560 | $42,719 |
| Part-Time (24 hrs) | $492.91 | $2,136 | $25,631 |
| Per Diem (16 hrs) | $328.61 | $1,424 | $17,088 |
Compare LMT Wages With Similar Roles
| Role | Median Hourly |
|---|---|
| Massage Therapist (Fremont) | $20.54 |
| Physical Therapist Assistant (National Avg) | $31.26 |
| Occupational Therapy Assistant (National Avg) | $32.45 |
| Medical Assistant (National Avg) | $20.14 |
| Exercise Trainer/Fitness Instructor (National Avg) | $23.95 |
Massage Therapists in Fremont, CA earn a median of $42,717 per year (2026 est.), which is 31.07% lower than the national median of $61,975 and 19.70% below the California state average of $53,197.
Massage Therapist Hourly Pay vs. Cost of Living
Working 24h/week at $20.54/hr = $25,631/year (purchasing power: $22,663).
Working 40h/week (full-time) = $42,719/year (purchasing power: $37,771).
CoL index: 113.1 (100 = national average).
2019 BLS Actual
$14.19/hr
2025 BLS Actual
$19.37/hr
2026 Current Est.
$20.54/hr
2019–2027 Growth
+53.5%
Hourly Rate Trajectory for Massage Therapists in Fremont (2019–2027)
2019–2025: actual BLS OEWS data for this metro area. 2026+: CAGR 6.03% projection.
| Year | Hourly Rate | Status |
|---|---|---|
| 2019 | $14.19/hr | Actual |
| 2020 | $14.46/hr | Actual |
| 2021 | $15.55/hr | Actual |
| 2022 | $16.52/hr | Actual |
| 2023 | $18.33/hr | Actual |
| 2024 | $32.49/hr | Actual |
| 2025 | $19.37/hr | Actual |
| 2026(current) | $20.54/hr | Estimated |
| 2027 | $21.78/hr | Projected |
Based on 7 years of BLS OEWS metropolitan area data, the median hourly rate for massage therapists in Fremont grew 36.5% from $14.19/hr (2019) to $19.37/hr (2025). At a 6.03% projected growth rate, hourly pay is expected to reach $21.78/hr by 2027. Part-time and per-diem massage therapists can use this multi-year trend to benchmark future contract negotiations.
Note: Historical values (2019–2025) are actual BLS OEWS figures for the Fremont metropolitan area, sourced from annual Occupational Employment and Wage Statistics surveys. 2026–2026 figures are current estimates, and 2027 values are projections, calculated using a 6.03% CAGR derived from 7-year BLS historical data. Actual salaries may vary based on employer, experience, certifications, and local market conditions.
Working as an Hourly Massage Therapist in Fremont
Examining the hourly compensation landscape reveals opportunities for additional income and varied compensation models. For example, part-time therapists aiming for a steady income can generate a respectable annual take-home compared to full-time counterparts, depending on client load. Per diem massage therapists in Fremont can charge between $25 and $100 per session, influenced by the nature of the establishment—chains offer lower rates while independent practitioners command higher fees. The choice between working for spas versus establishing a solo practice lays bare a salary-versus-benefits dilemma; while self-employed therapists might render $80 to $150 per 60-minute session, they must account for marketing, taxes, and insurance costs. The ability to negotiate contracts, especially in a market where competition may drive rates down, becomes essential for those seeking a favorable position within varied employment settings, such as resorts, hospitals, or private practices.
More salary data for Fremont, CA:
Frequently Asked Questions
What is the hourly rate for massage therapists in Fremont in 2026?
How much do part-time massage therapists make in Fremont?
Are massage therapists in Fremont paid hourly or salary?
How much does a full-time massage therapist make per year in Fremont?
Do massage therapists earn more per hour working part-time in Fremont?
Related Pages
Compare Salaries
Career Resources
Nearby Cities in California
Written by Jordan Lee, LMT
Career Analyst
Jordan Lee has 10 years of experience in massage therapy. They specialize in sports massage. They work in a wellness center.
Methodology & Data Source
Hourly wage figures on this page are 2026 projections based on the Bureau of Labor Statistics Occupational Employment and Wage Statistics (OEWS) survey, May 2026 release. A 6.03% compound annual growth rate (CAGR), derived from 6-year national BLS wage trends, was applied to estimate current 2026 hourly rates for massage therapists in Fremont. Part-time and full-time income estimates assume consistent weekly hours and do not account for overtime, benefits, or seasonal variation.
Data Sources & Methodology
Salary data for Fremont is estimated from official BLS state-level occupational wage data (2025), adjusted for regional cost-of-living differences using BEA RPP (Regional Price Parities).
2026 figures are projected from 2025 BLS data using a compound annual growth rate (CAGR) of 6.03%, derived from historical BLS wage trends for massage therapists (SOC 31-9011).
Compiled and verified by Jordan Lee, LMT, a licensed massage therapist with 10+ years of clinical experience. · View source data at BLS.gov